Location Data in the Graph
When transforms or data imports add location information to your graph, entities with addresses or geographic coordinates appear as nodes. Running transforms like Endato enriches your graph with persons and their associated addresses.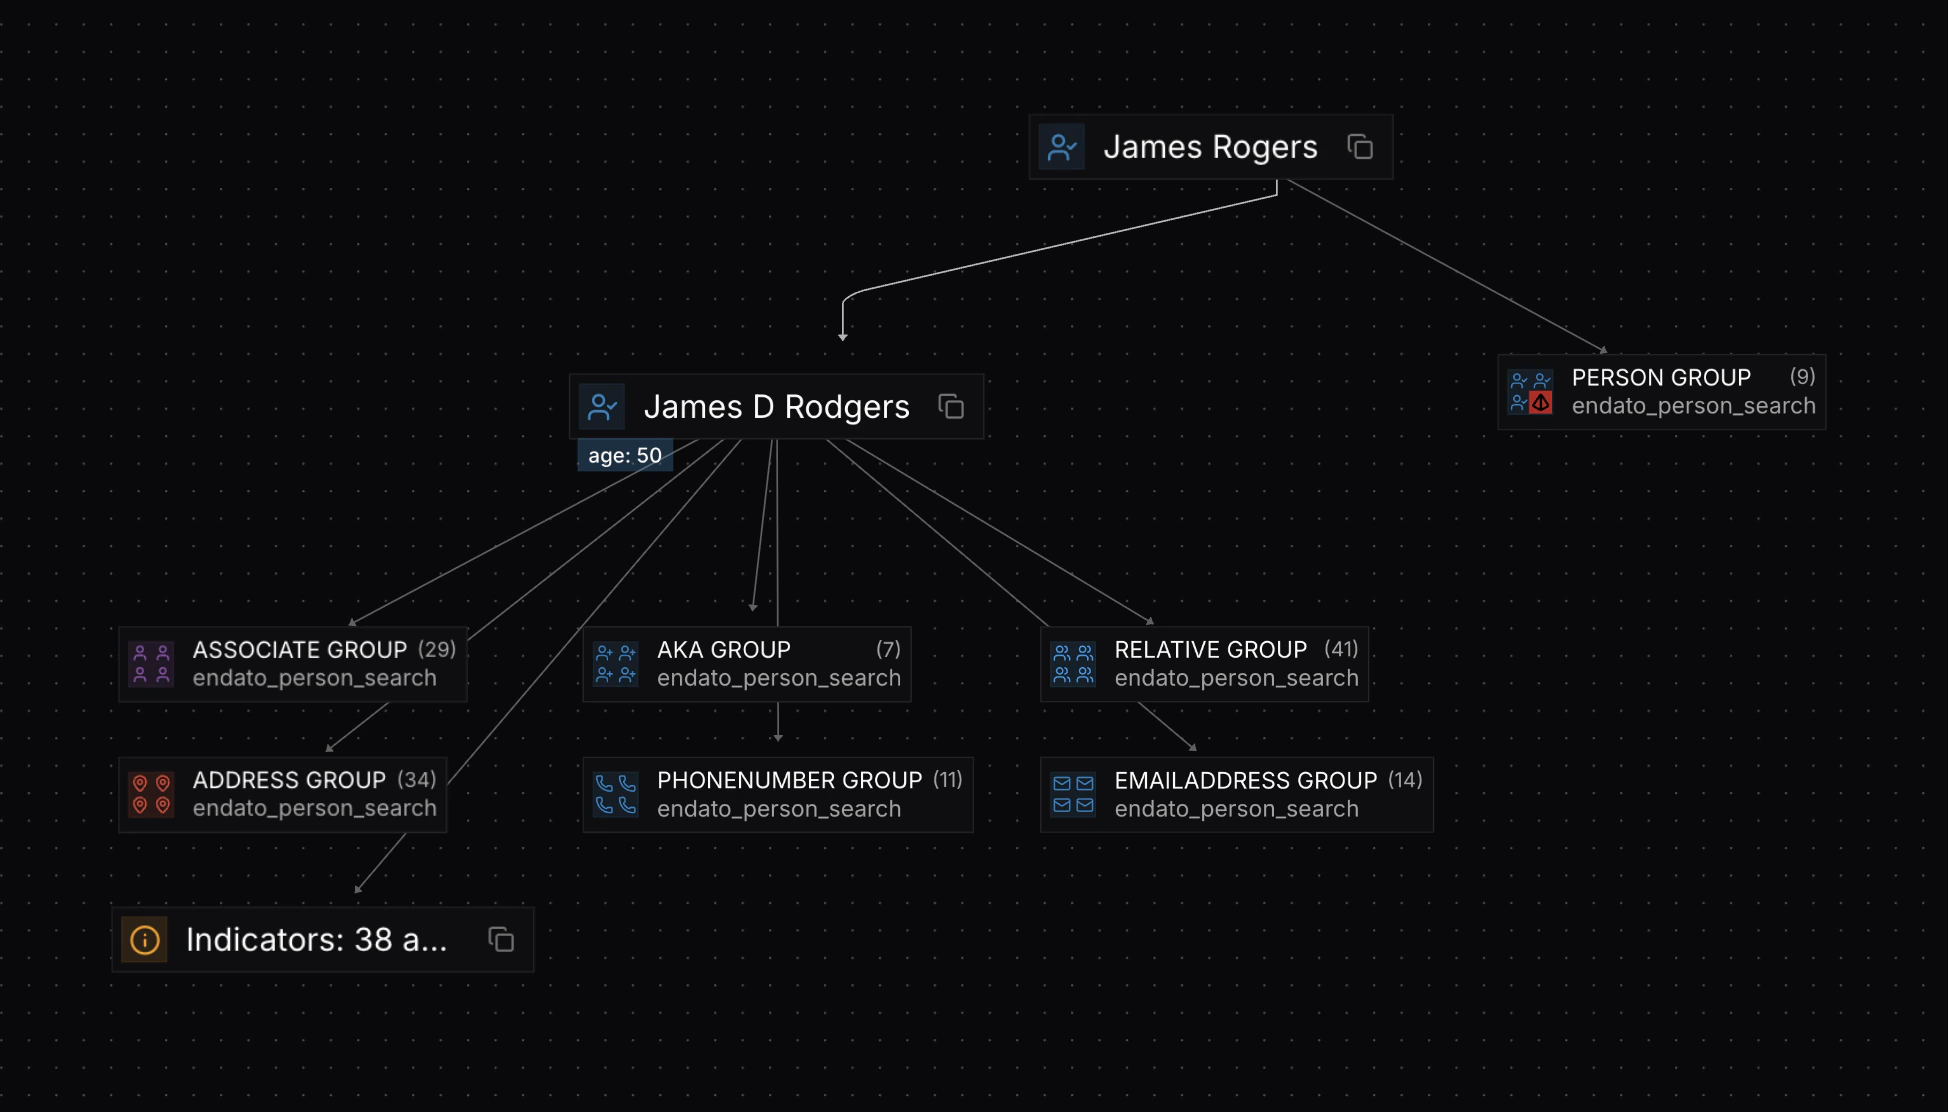
Switching to Map View
Toggle between Graph and Map views using the view selector in the toolbar. The Map View displays all location data from your graph as markers on an interactive map—it’s an alternative visualization of the same data, not a separate workspace. No actions can be performed directly on the map; it’s view-only.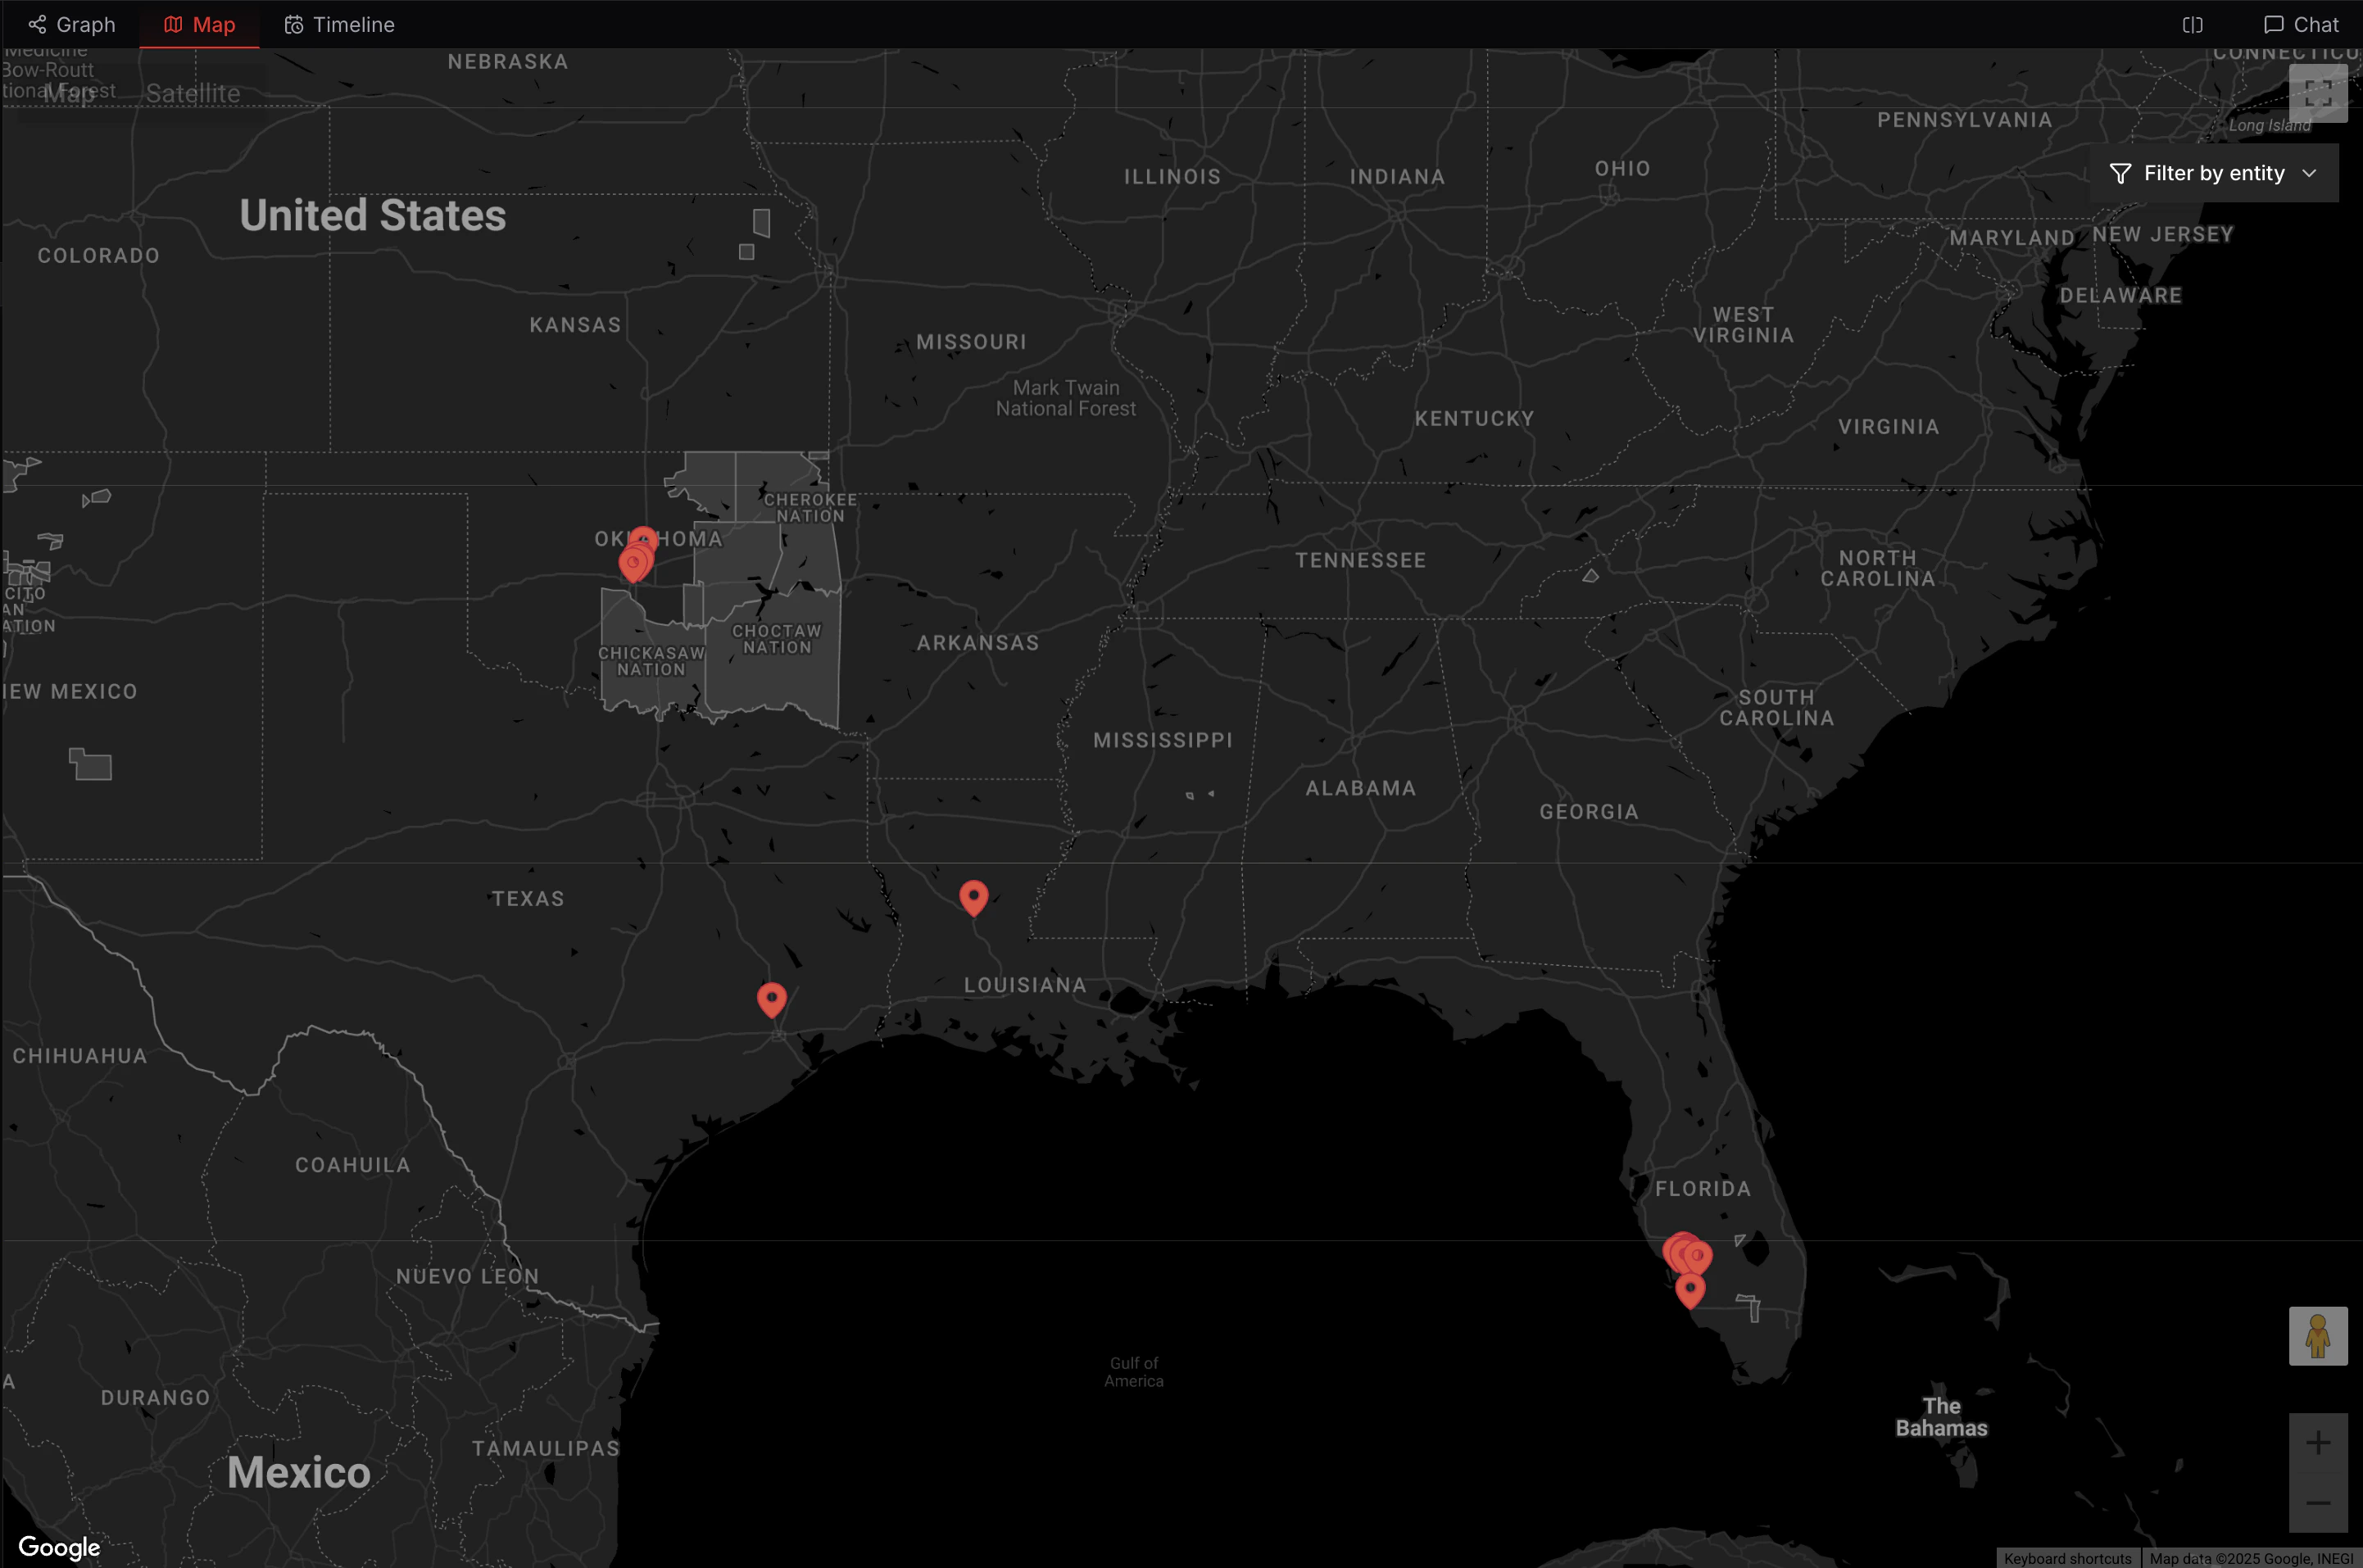
Marker Interactions
Click on any marker to view location details in the sidebar. This is equivalent to clicking the corresponding address node in the graph view—you see the same entity information and can view any associated nodes if the address is linked to persons or other entities.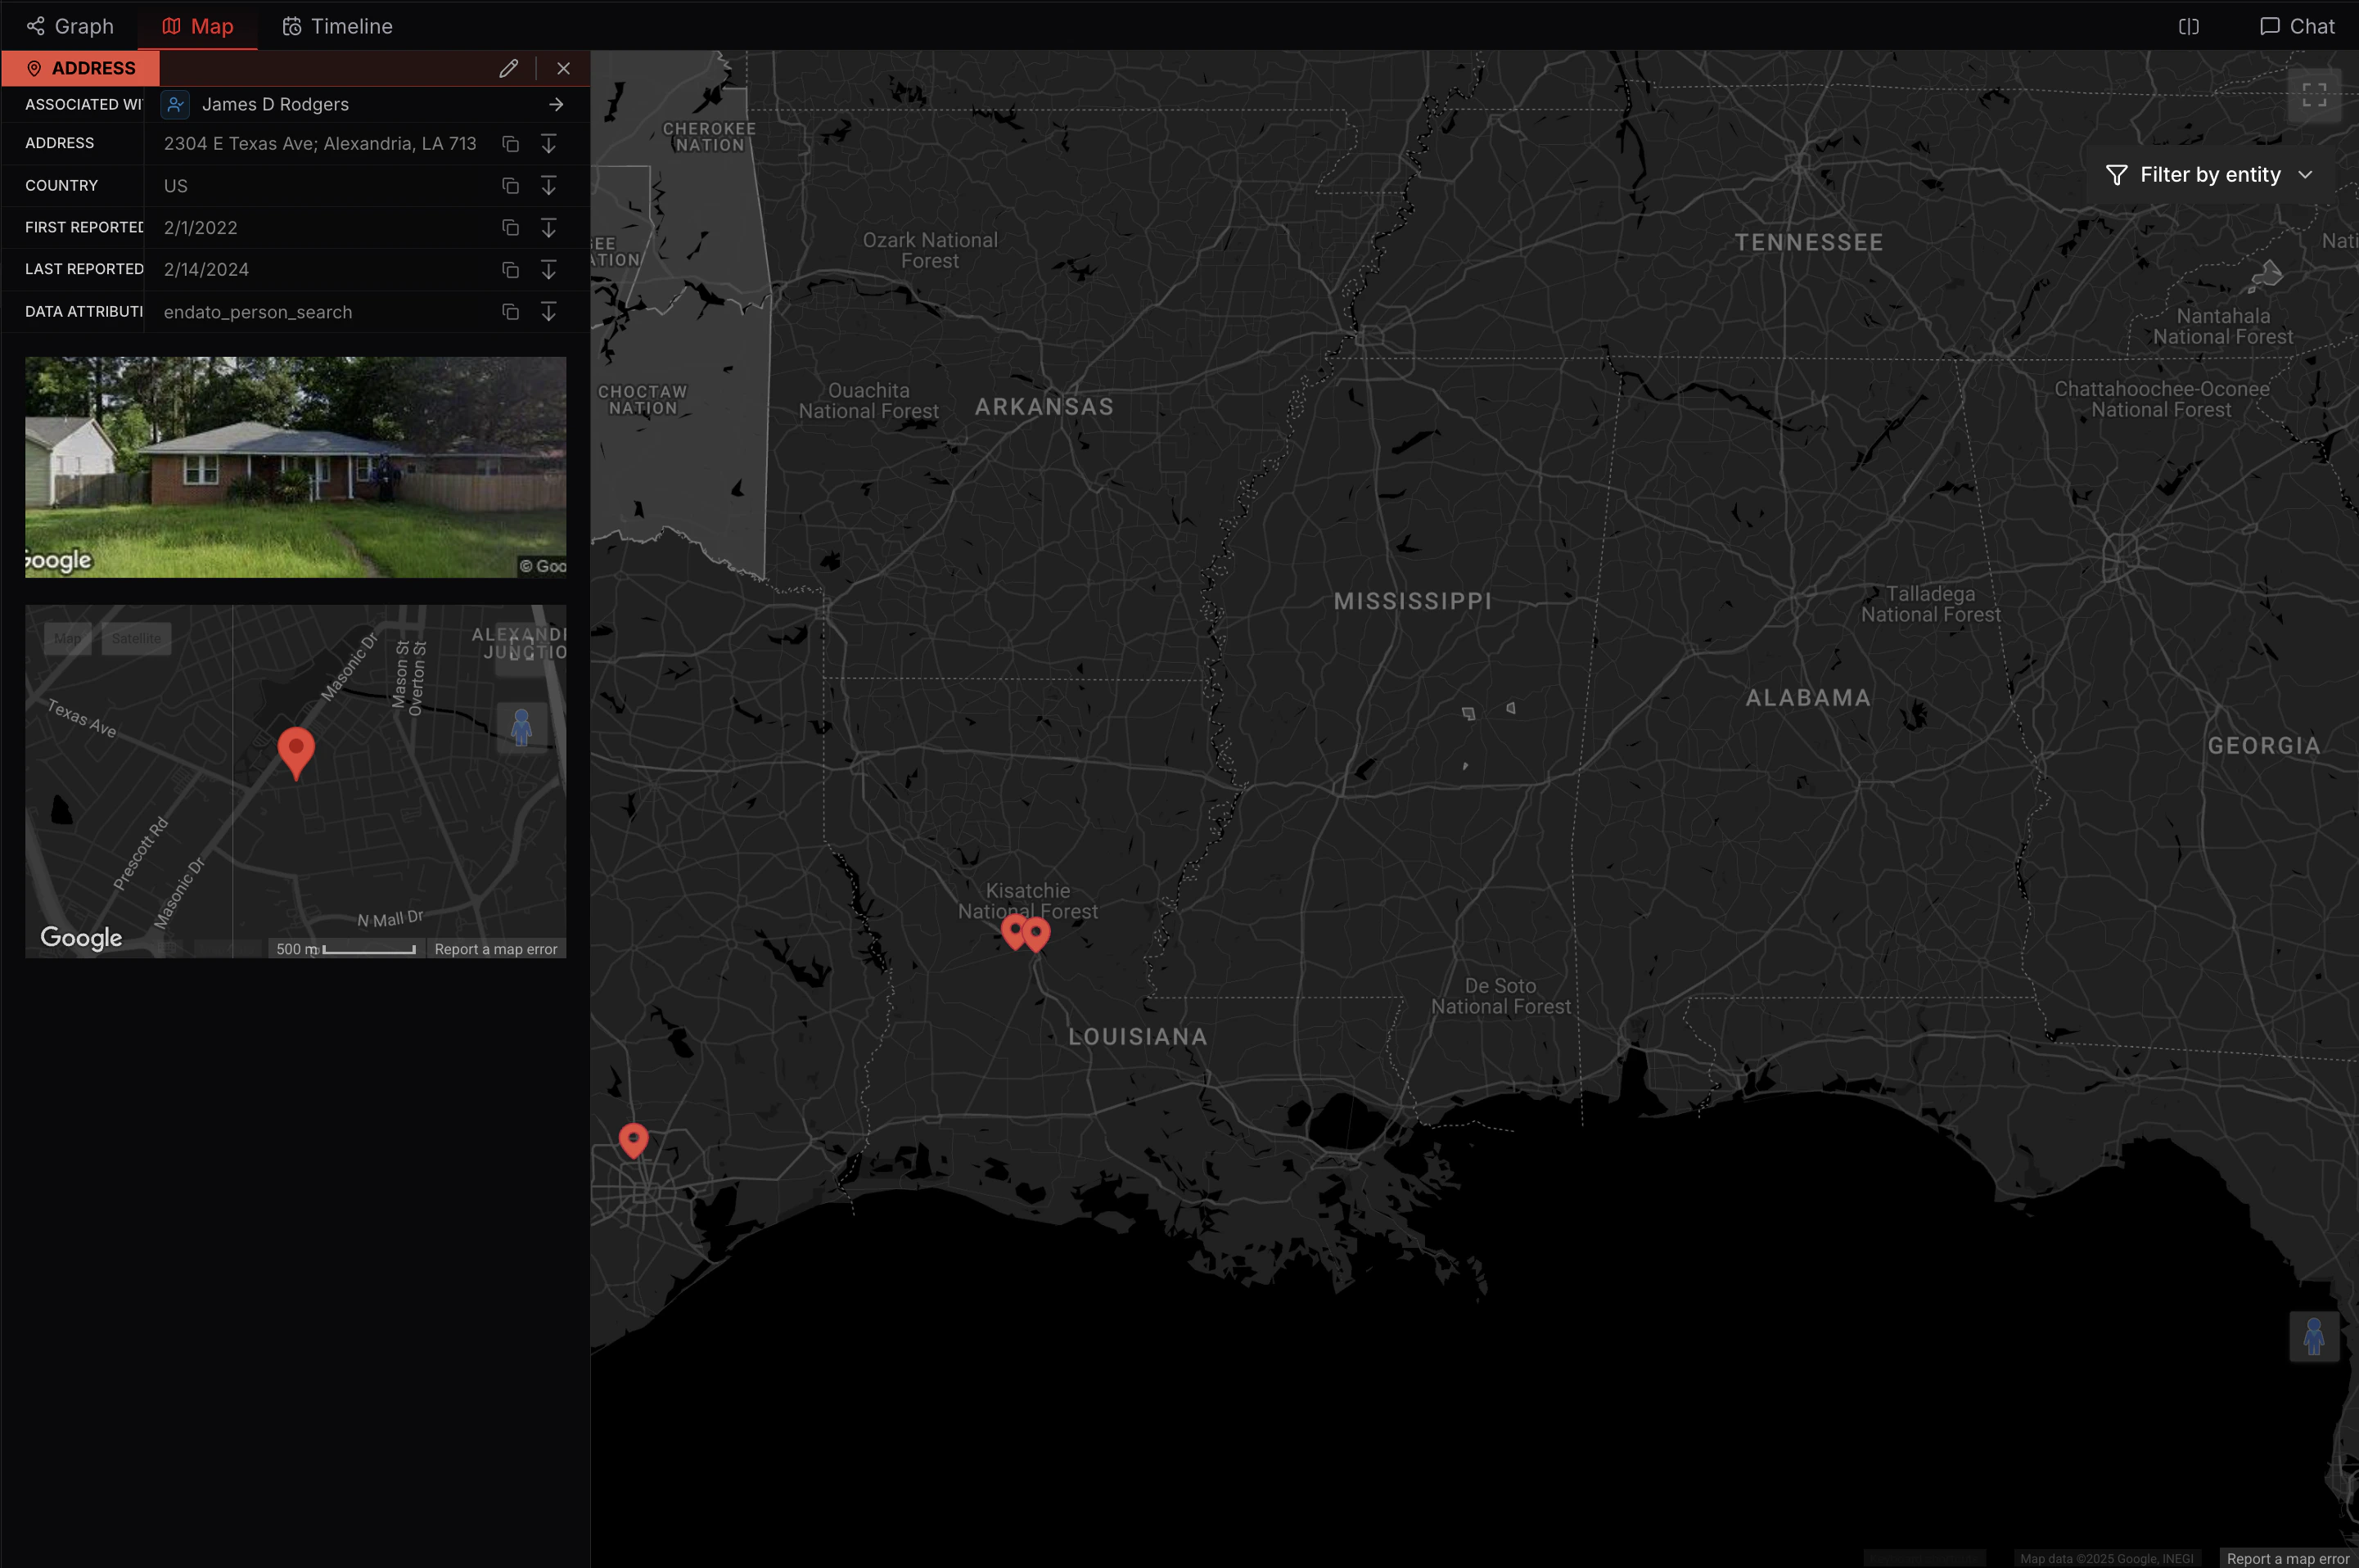
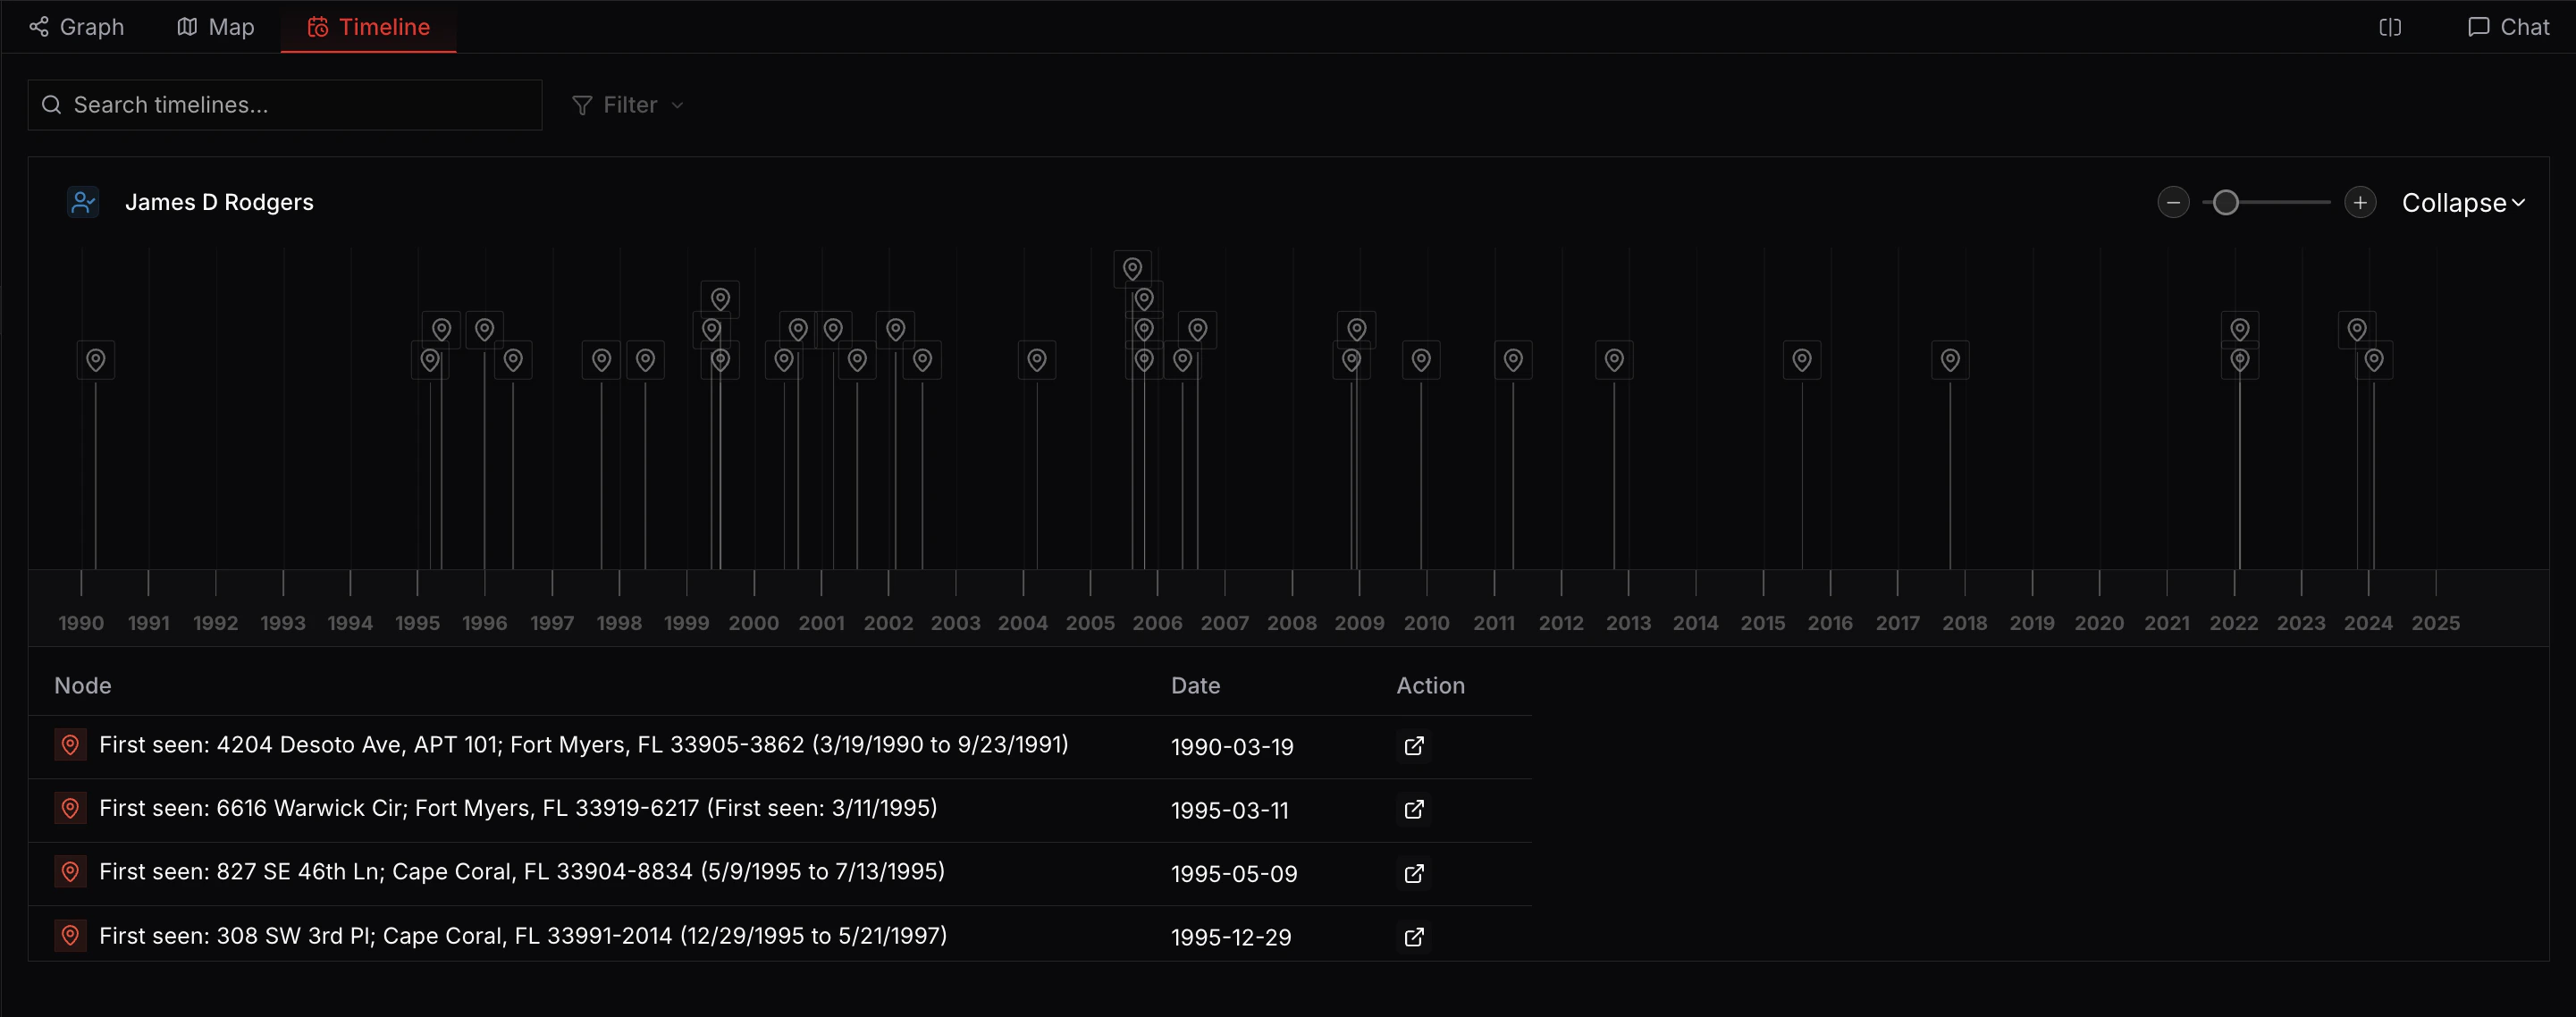
Timeline View
Toggle to Timeline View using the view selector in the toolbar. The Timeline displays nodes with time metadata arranged chronologically along a time axis—it’s a visualization of existing temporal data in your graph, not a separate workspace. Like Map View, no actions can be performed directly on the timeline; it’s view-only.