Block Layout
The block layout organizes nodes in a grid-like structure, making it ideal for viewing structured relationships and conducting link analysis. Brighter edges (arrows) indicate either a link node that is a shared result of multiple parents, or an intermediate node that has children. Darker arrows indicate nodes that haven’t been pivoted upon yet.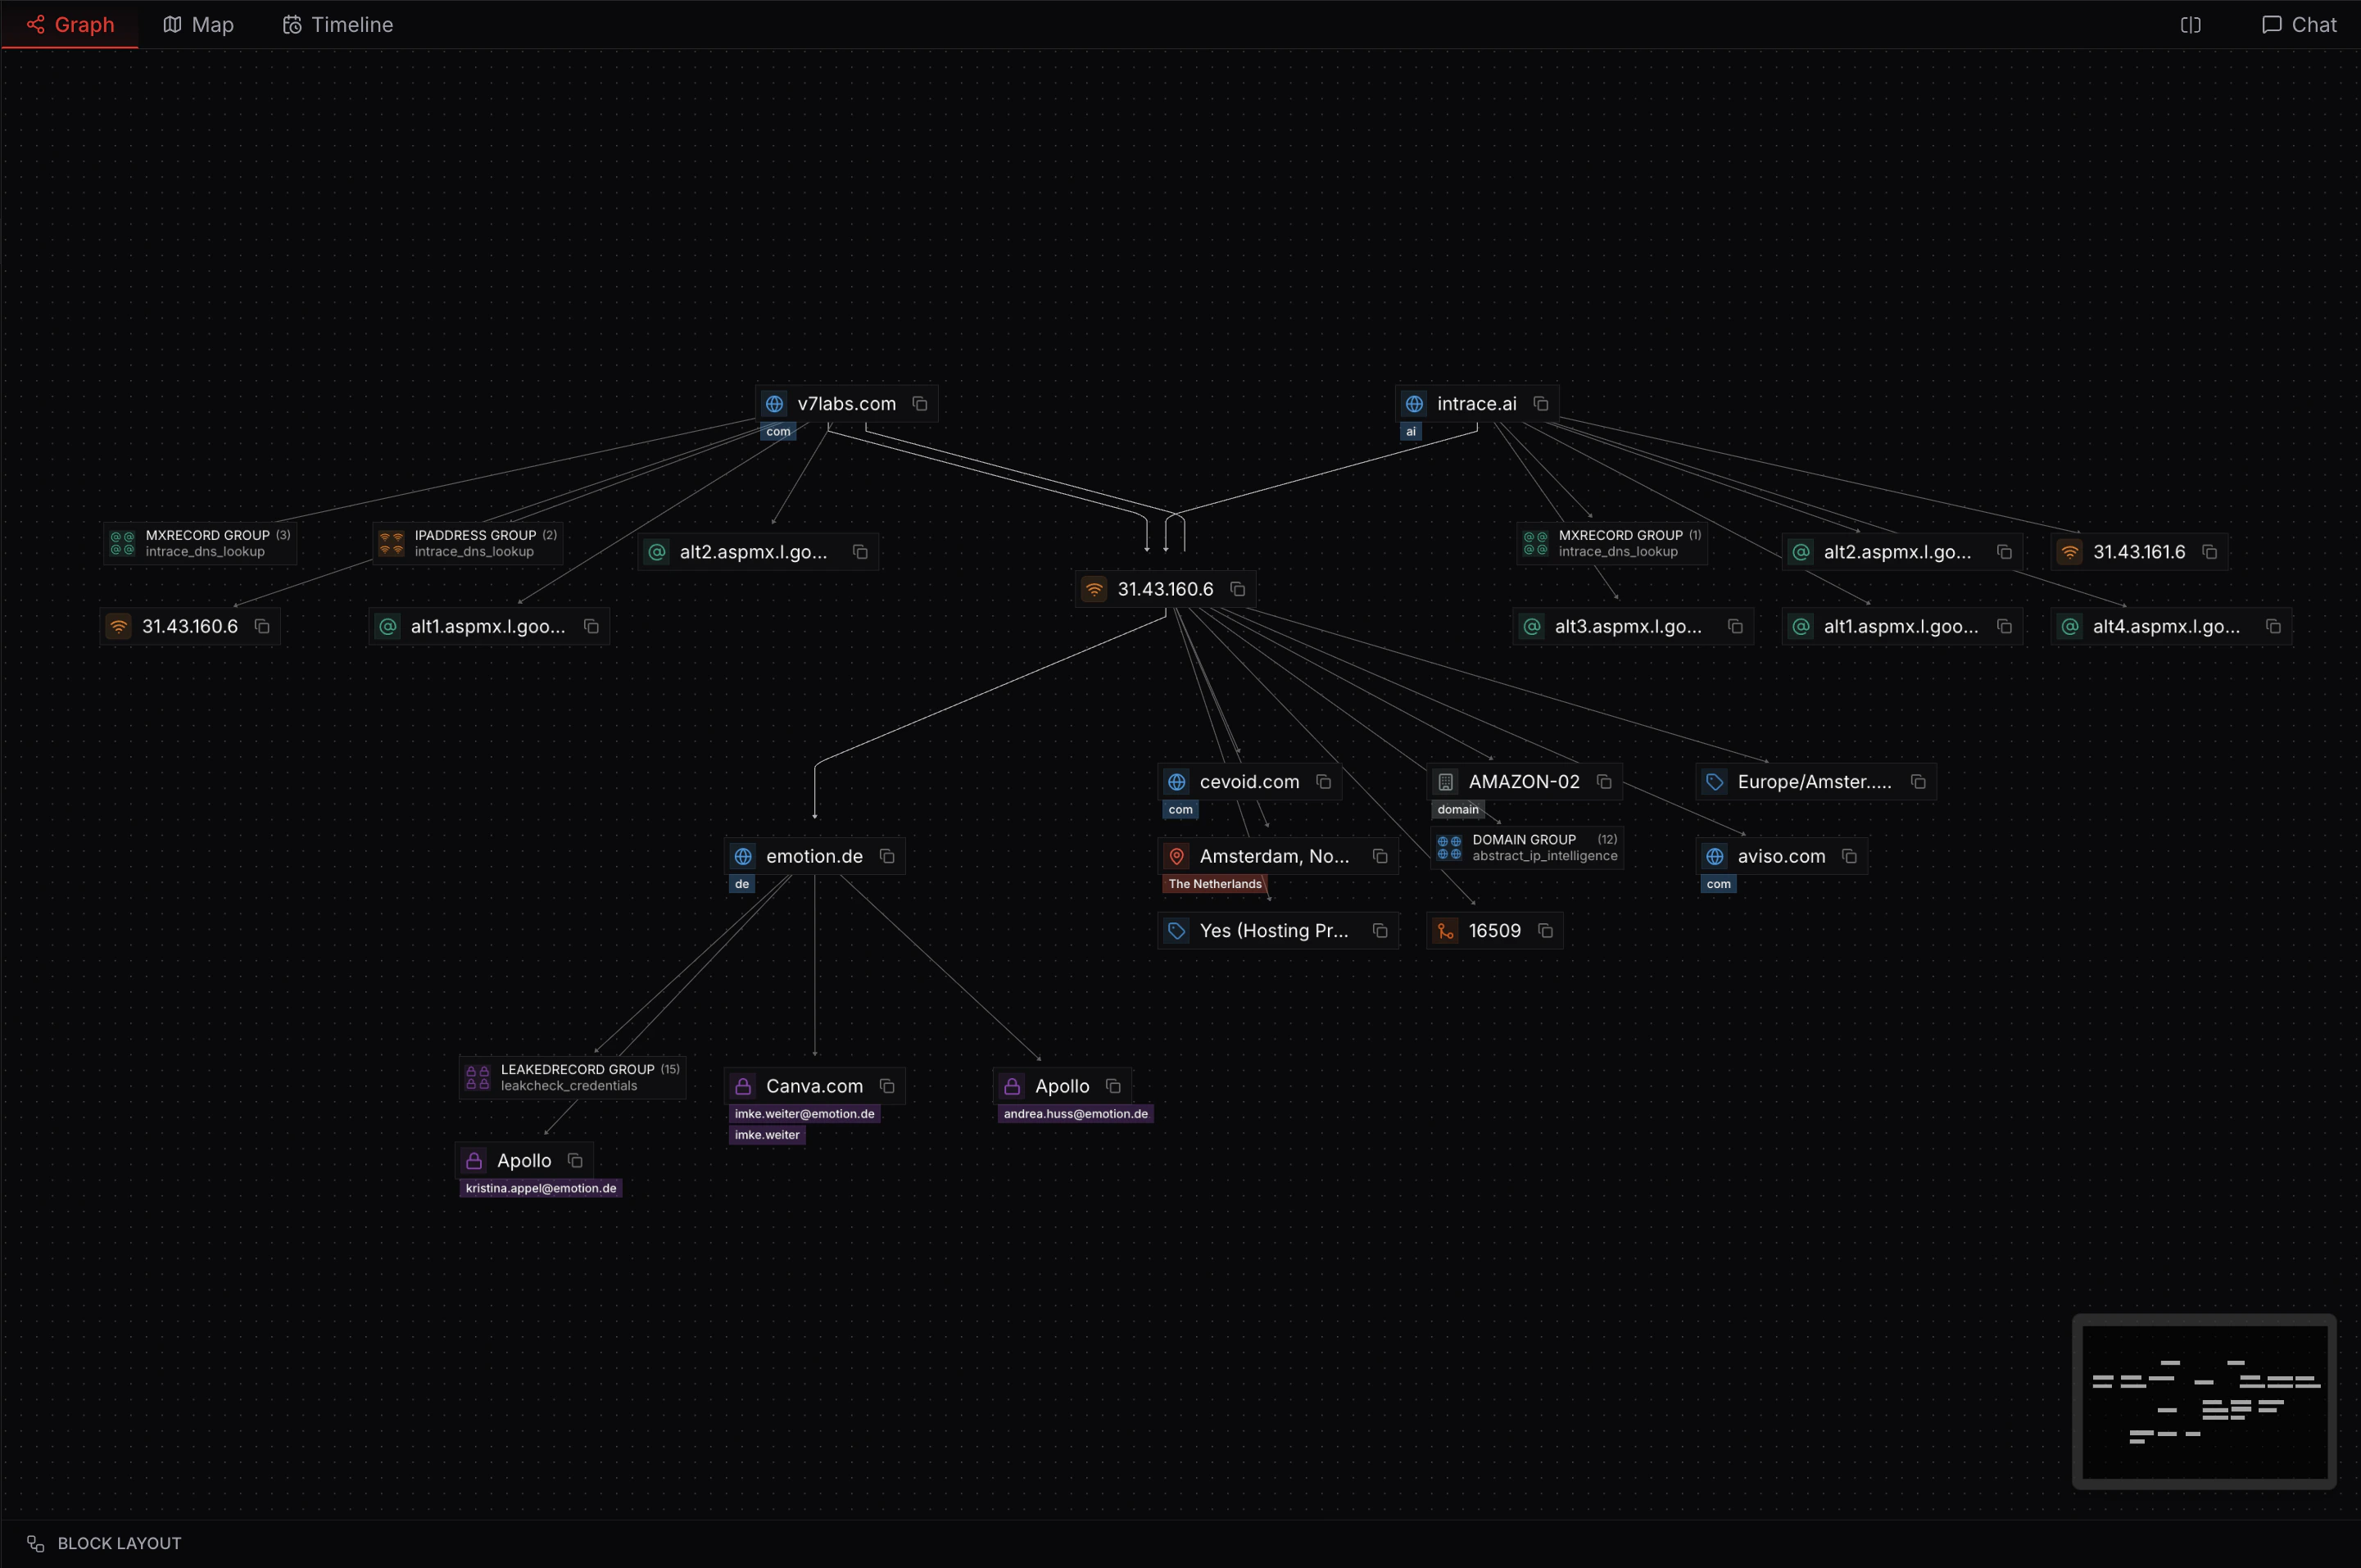
Circle Layout
The circle layout arranges nodes in a circular pattern, providing a balanced view that emphasizes connections and makes it easy to identify central nodes.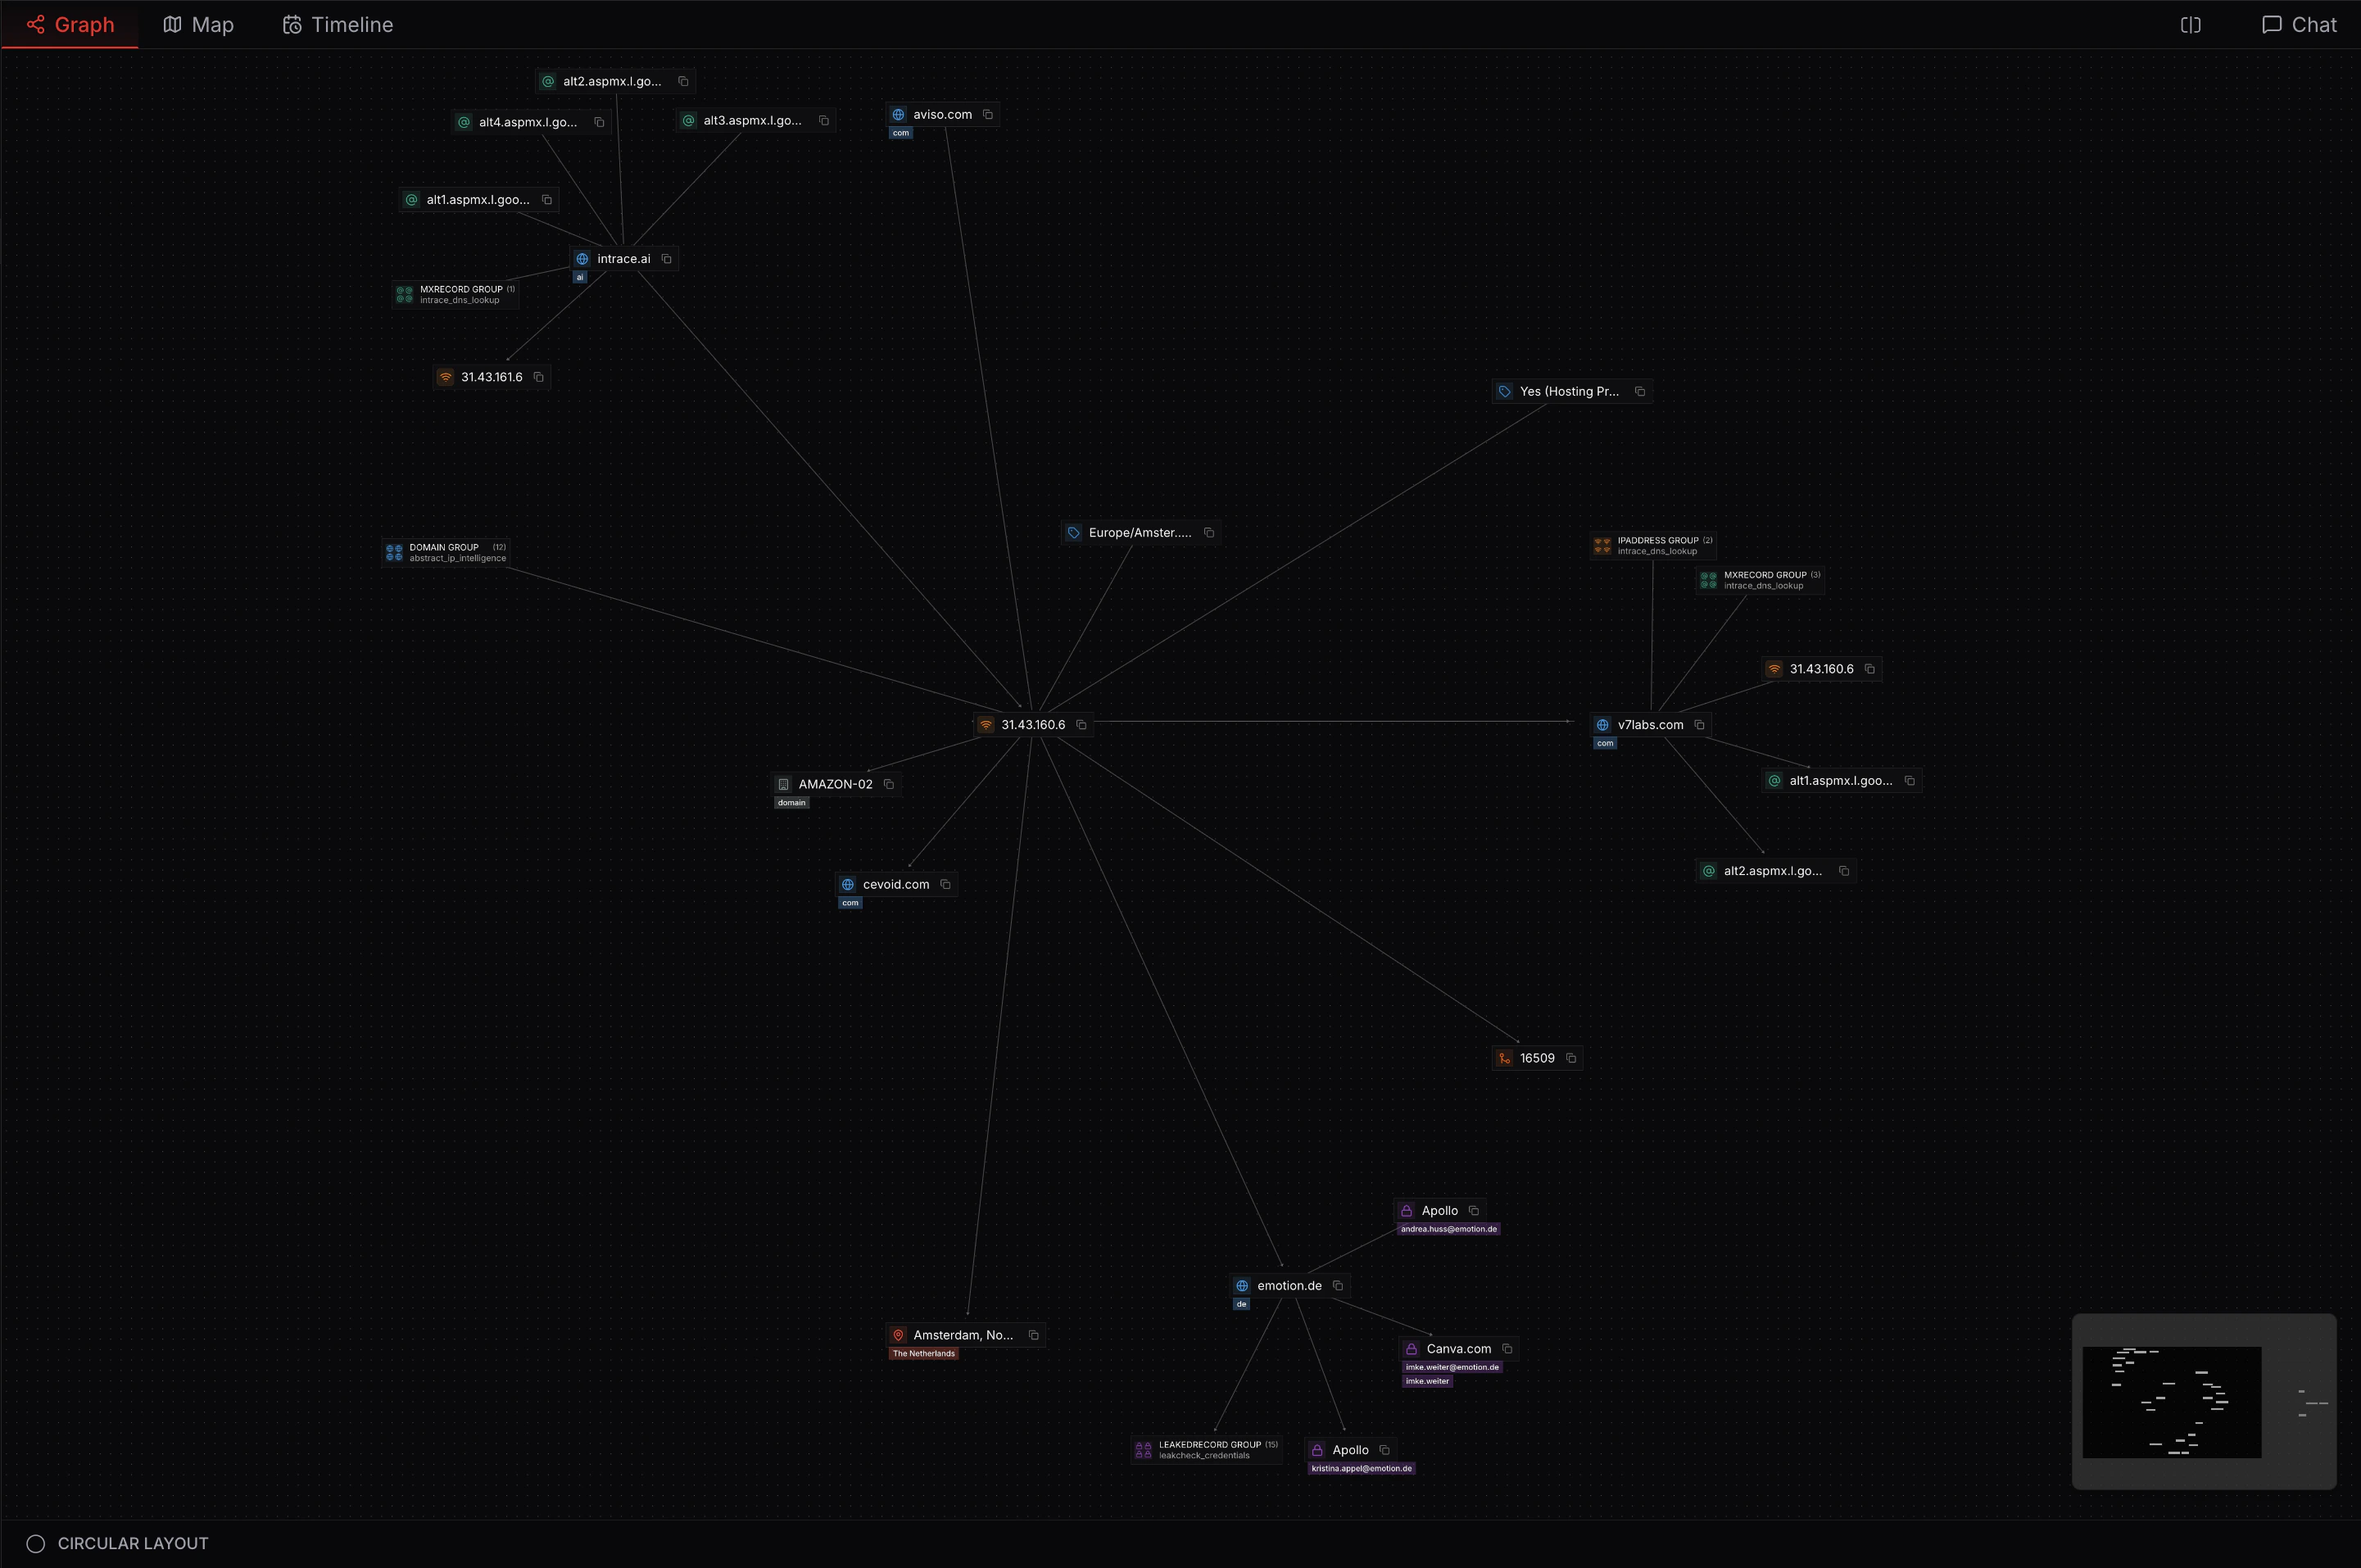
Hierarchical Layout
The hierarchical layout organizes nodes in a top-down tree structure, beneficial for understanding parent-child relationships.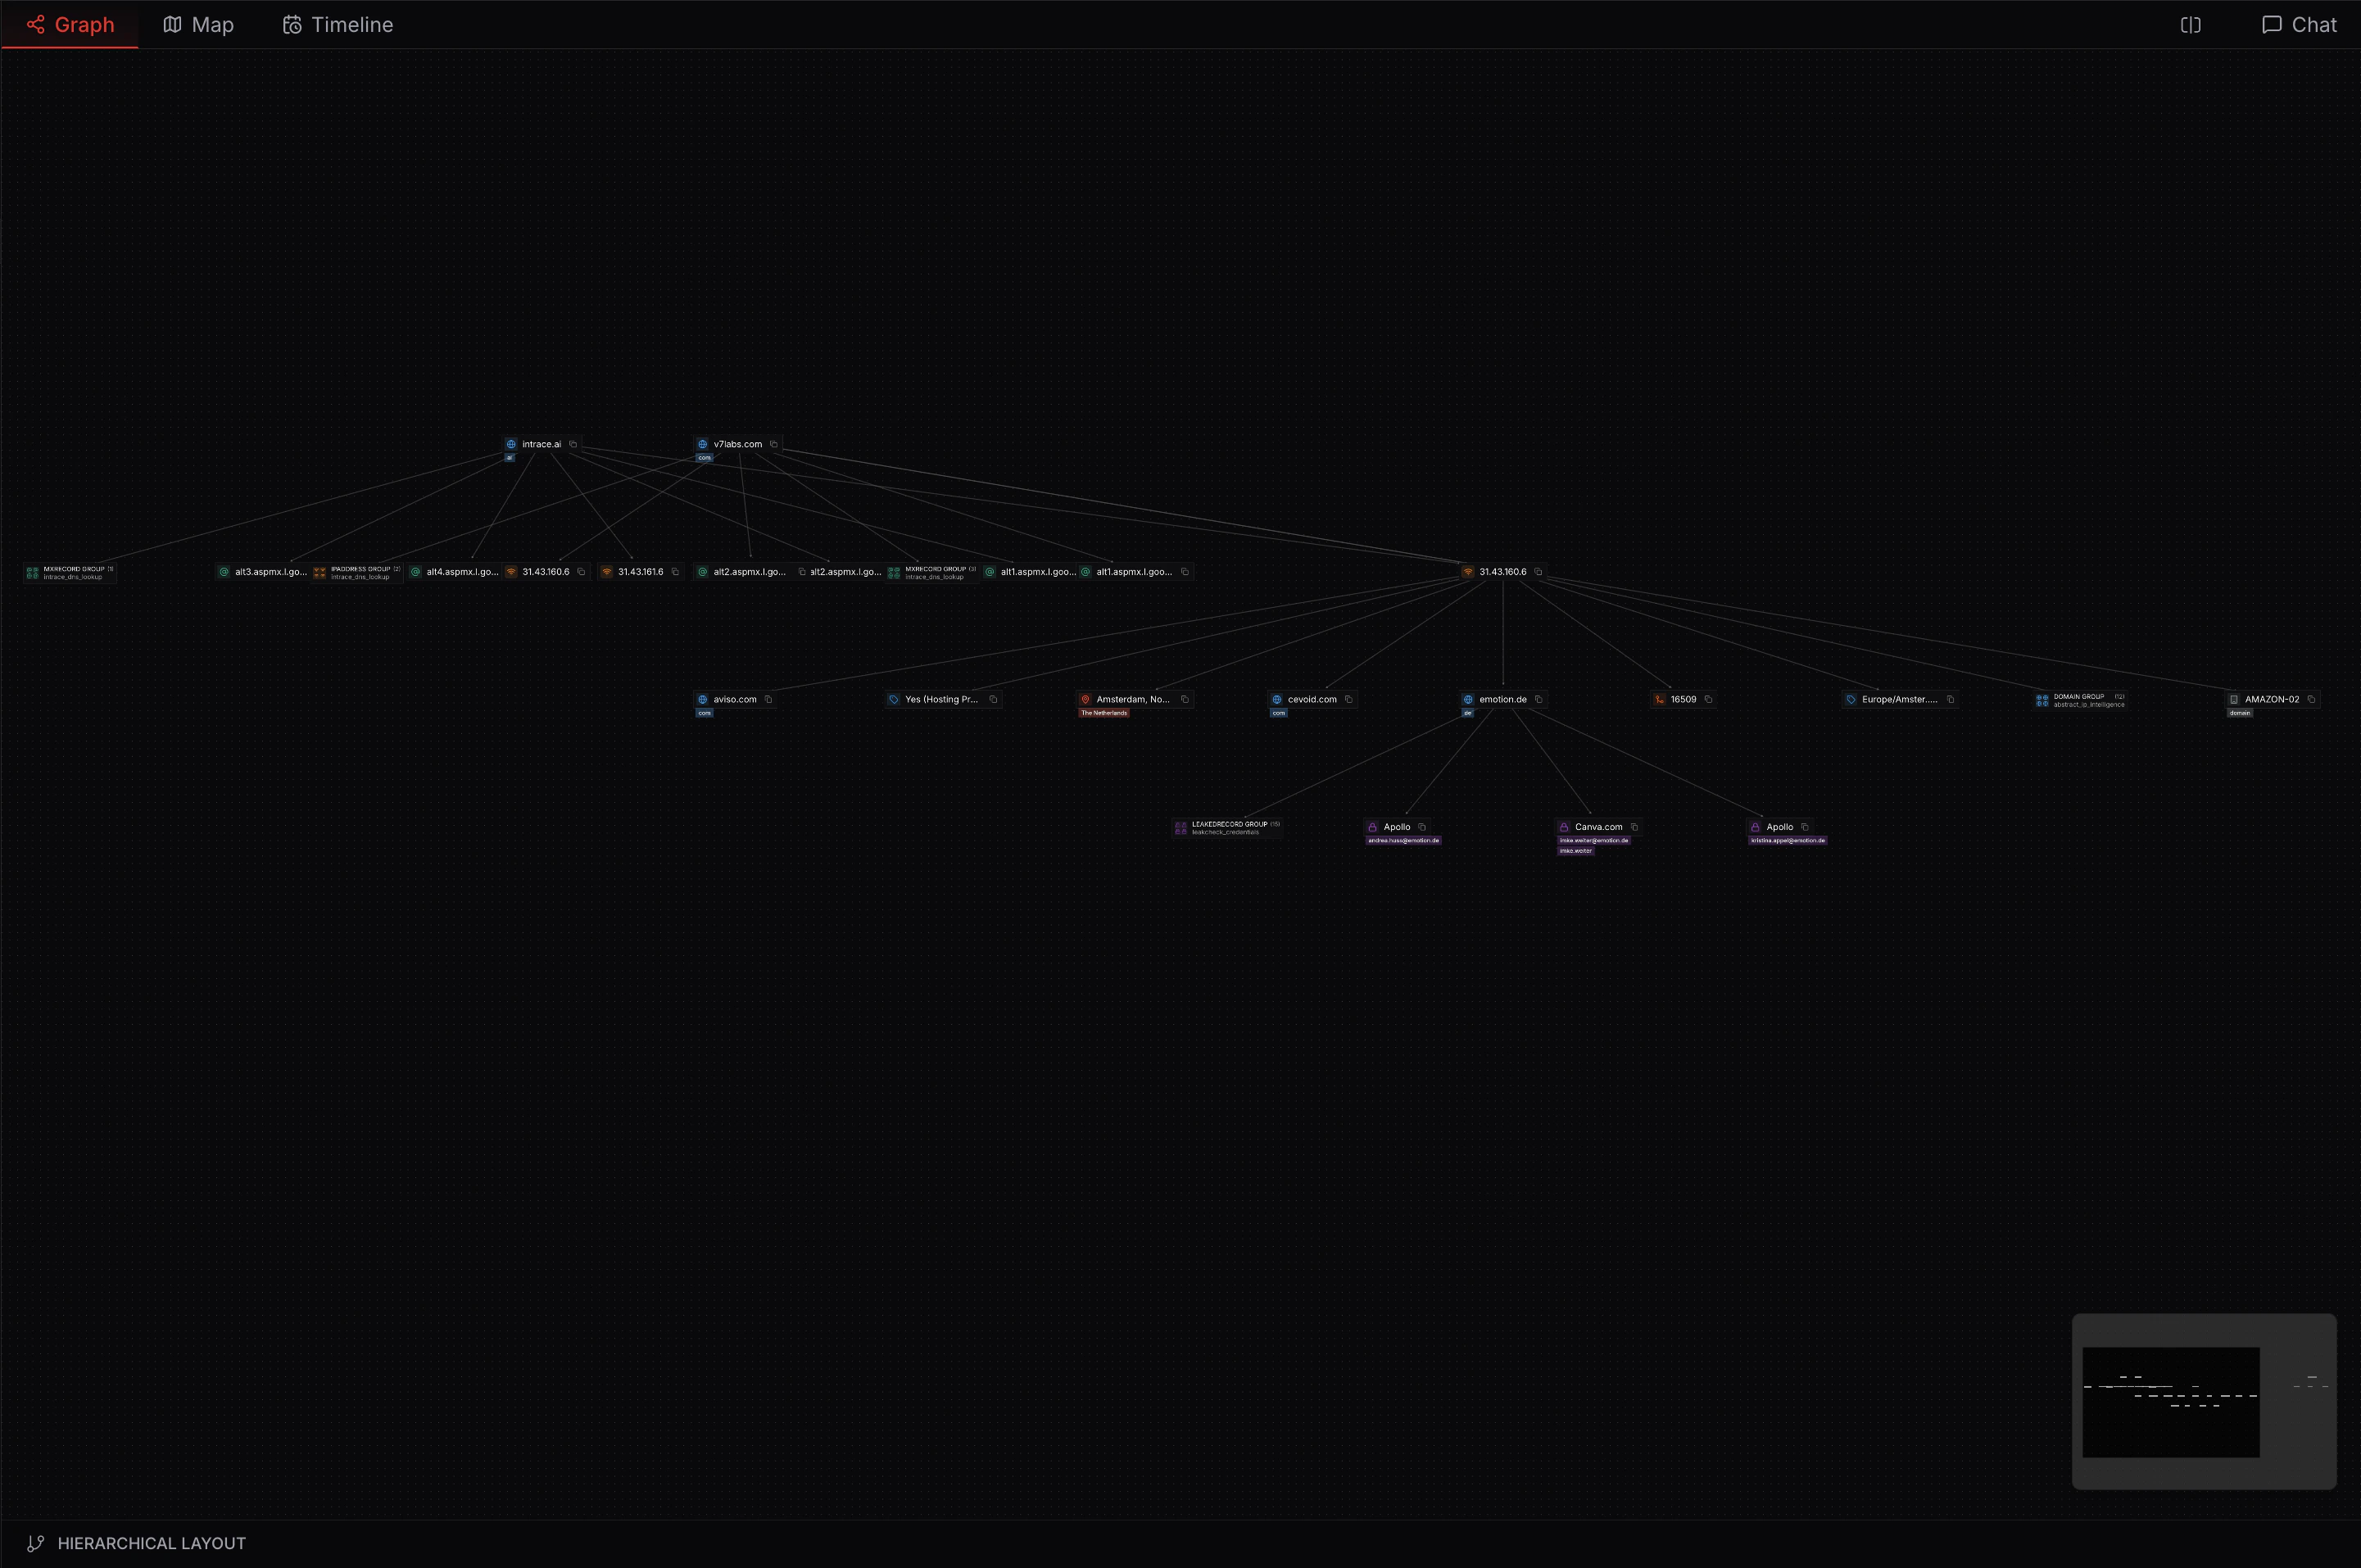
Views
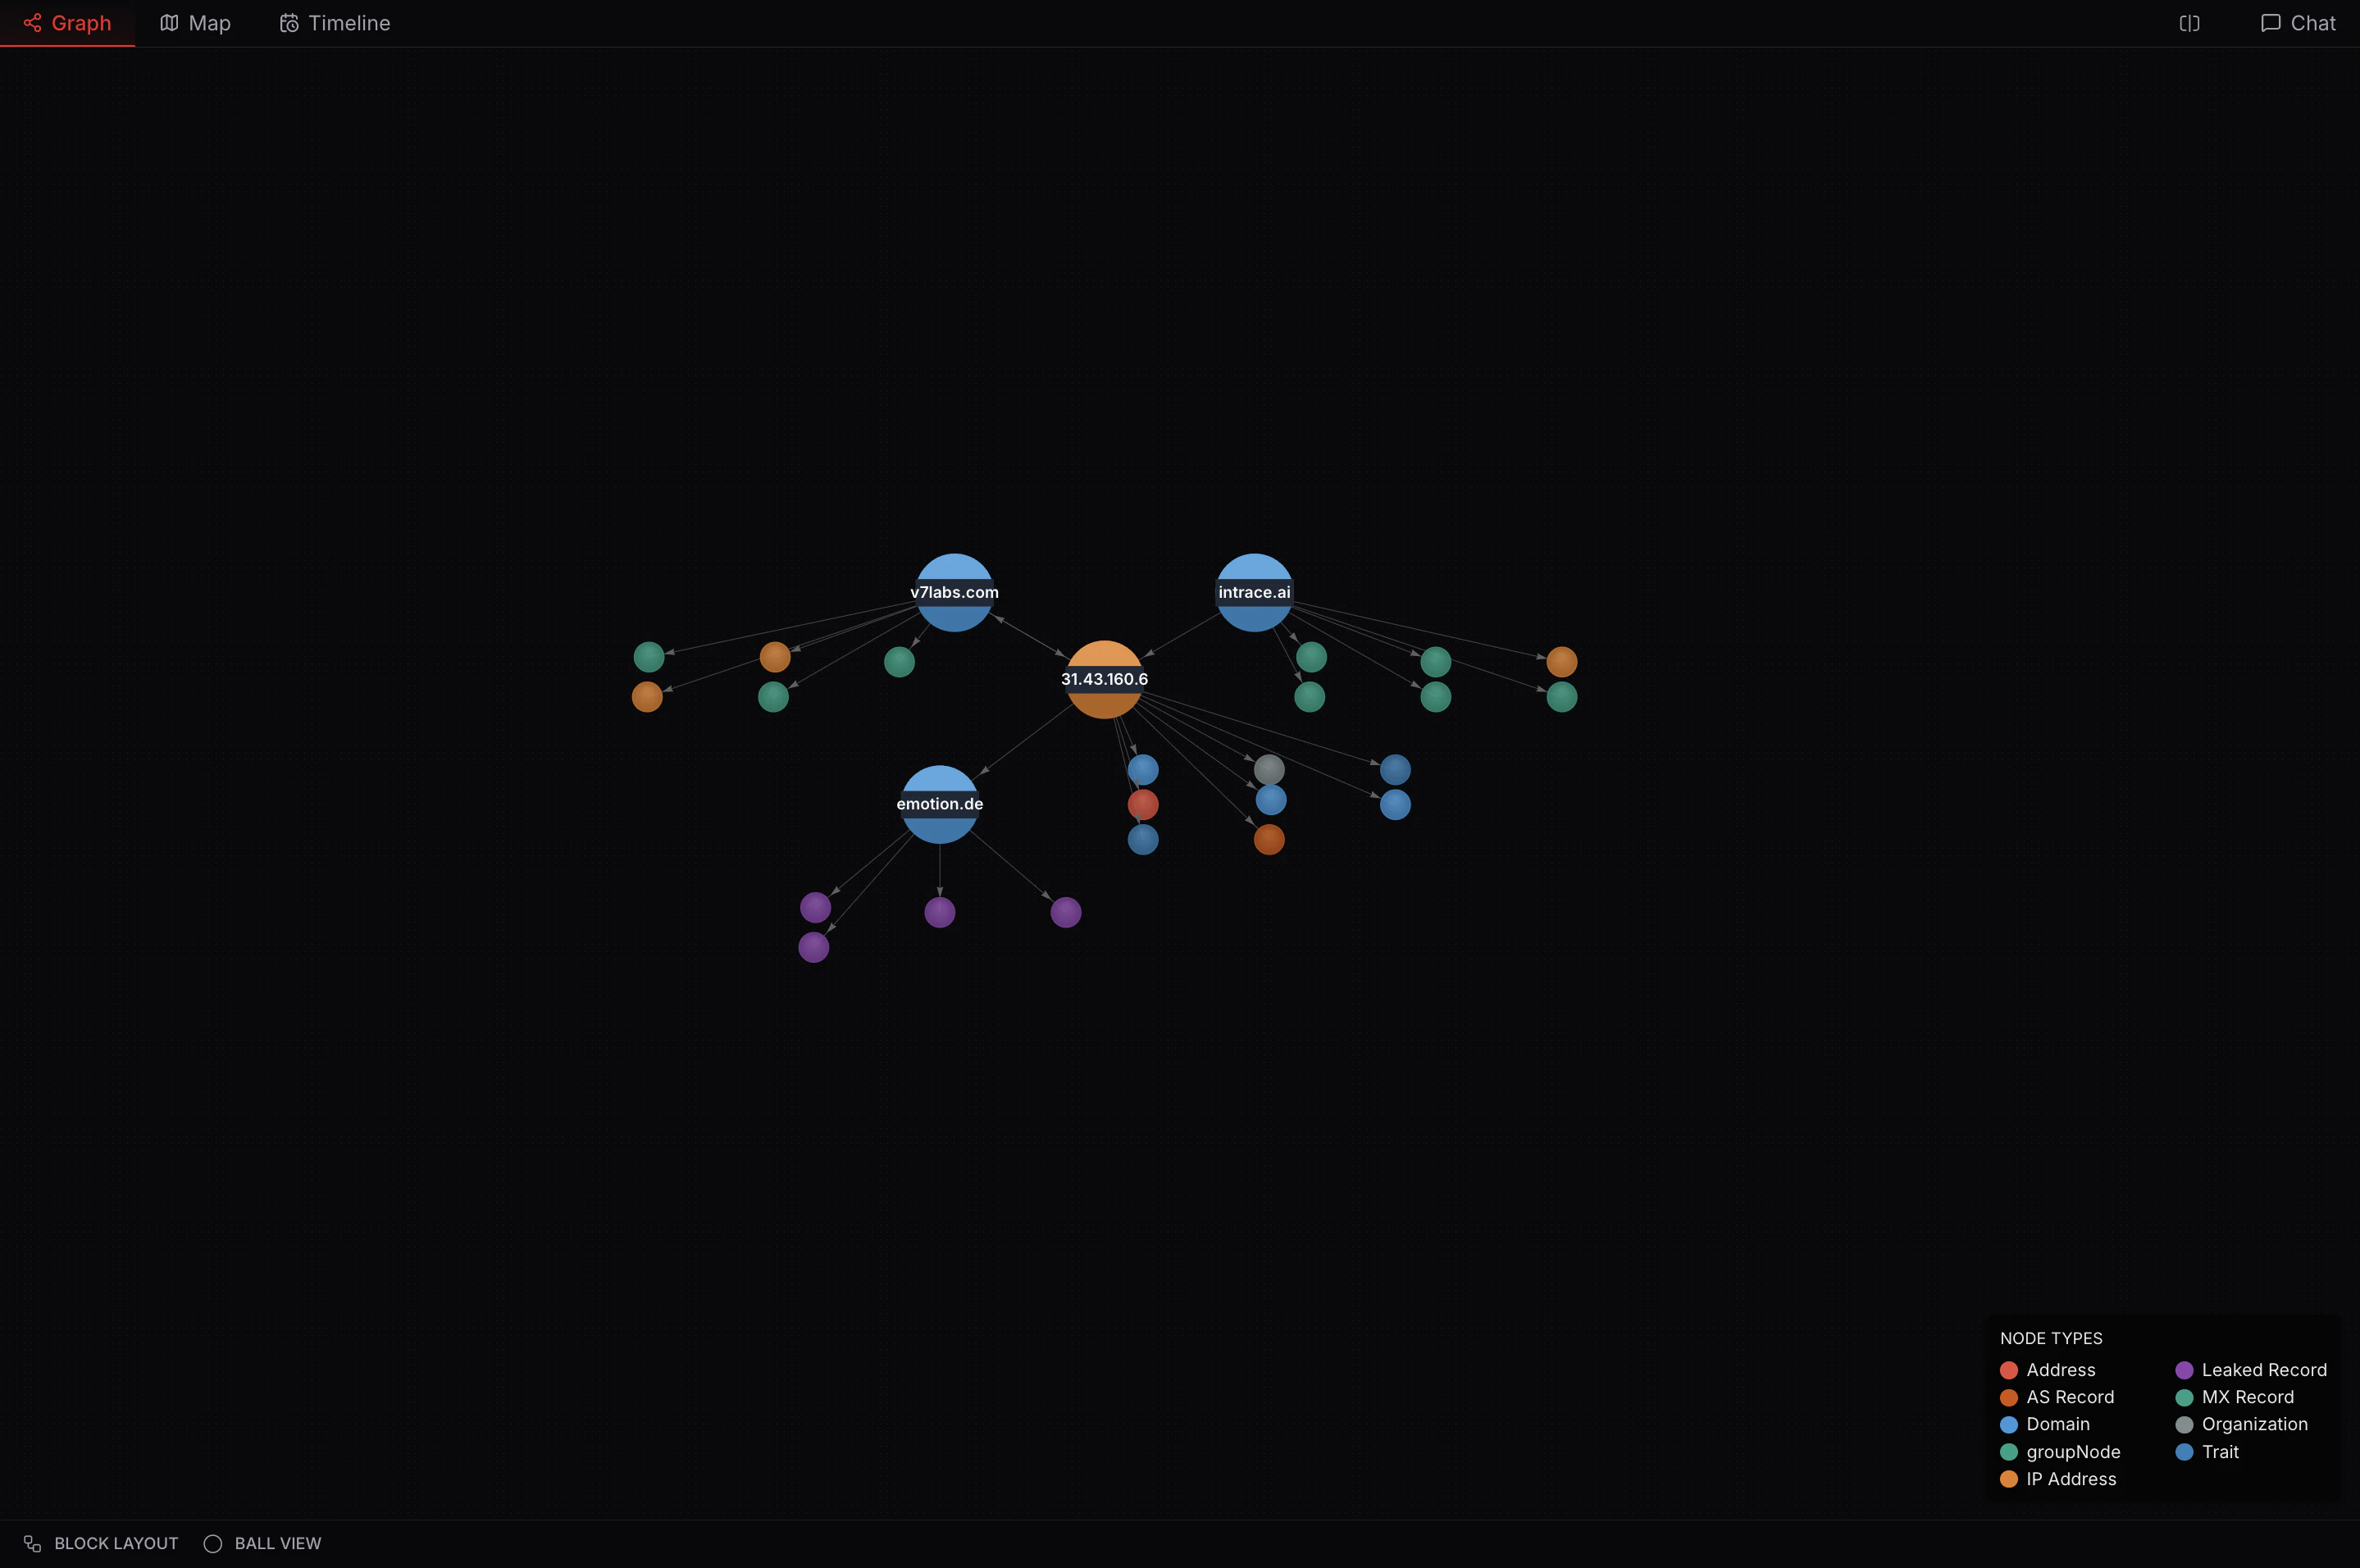
When zoomed out considerably, Intrace automatically switches to simplified view modes optimized for large-scale data visualization. These views are available in every layout and provide enhanced visibility of network structure at a high level.Icon View
Icon view displays nodes as enlarged icons with a key at the bottom of the screen, making it easy to identify node types and understand the overall structure of large networks. Parent and intermediate nodes are enlarged to emphasize hierarchical relationships.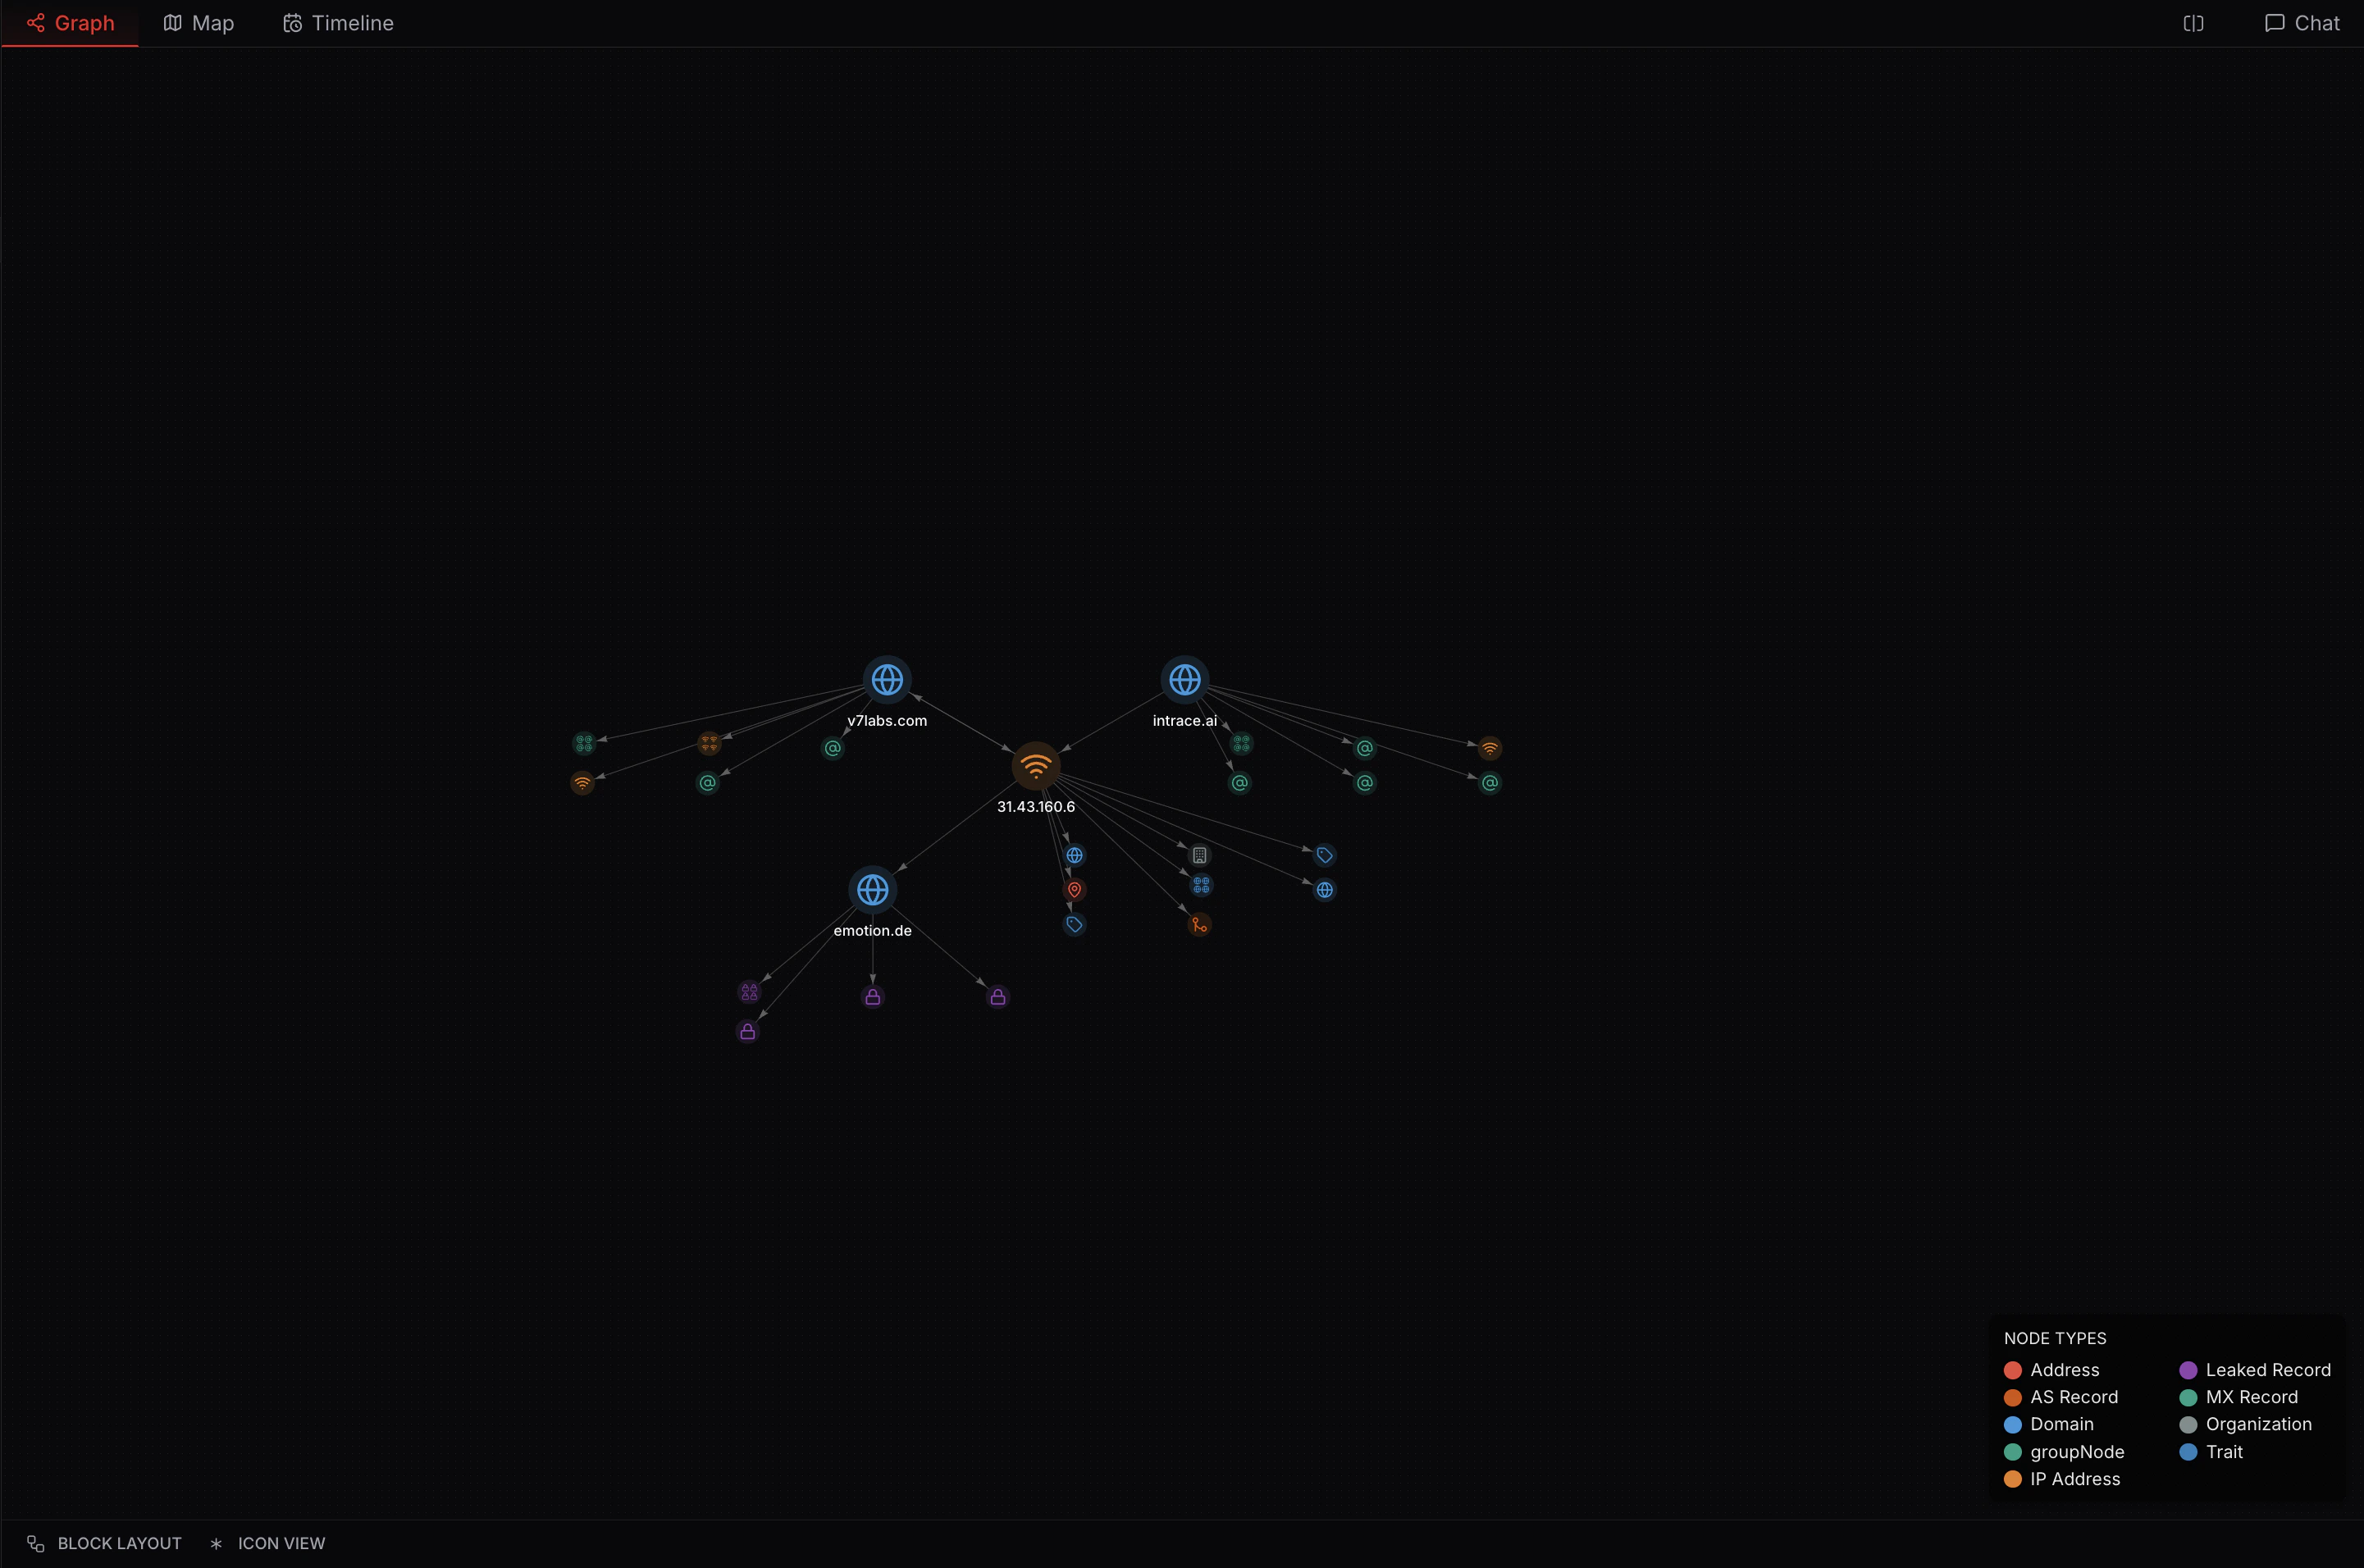
Ball View
Ball view provides a simplified visualization where nodes appear as colored circles without icons. Like icon view, it includes a key at the bottom and enlarges parent and intermediate nodes.