Core Concepts
The Graph operates on a node-and-edge model where entities are represented as nodes, and relationships between them are shown as connecting edges.Nodes
Nodes represent individual entities in your investigation, such as people, organizations, locations, or digital assets. Each node contains associated data and can be expanded to reveal additional connections.Edges
Edges are the connections between nodes, representing relationships like transactions, communications, associations, or other meaningful links between entities.Creating Nodes
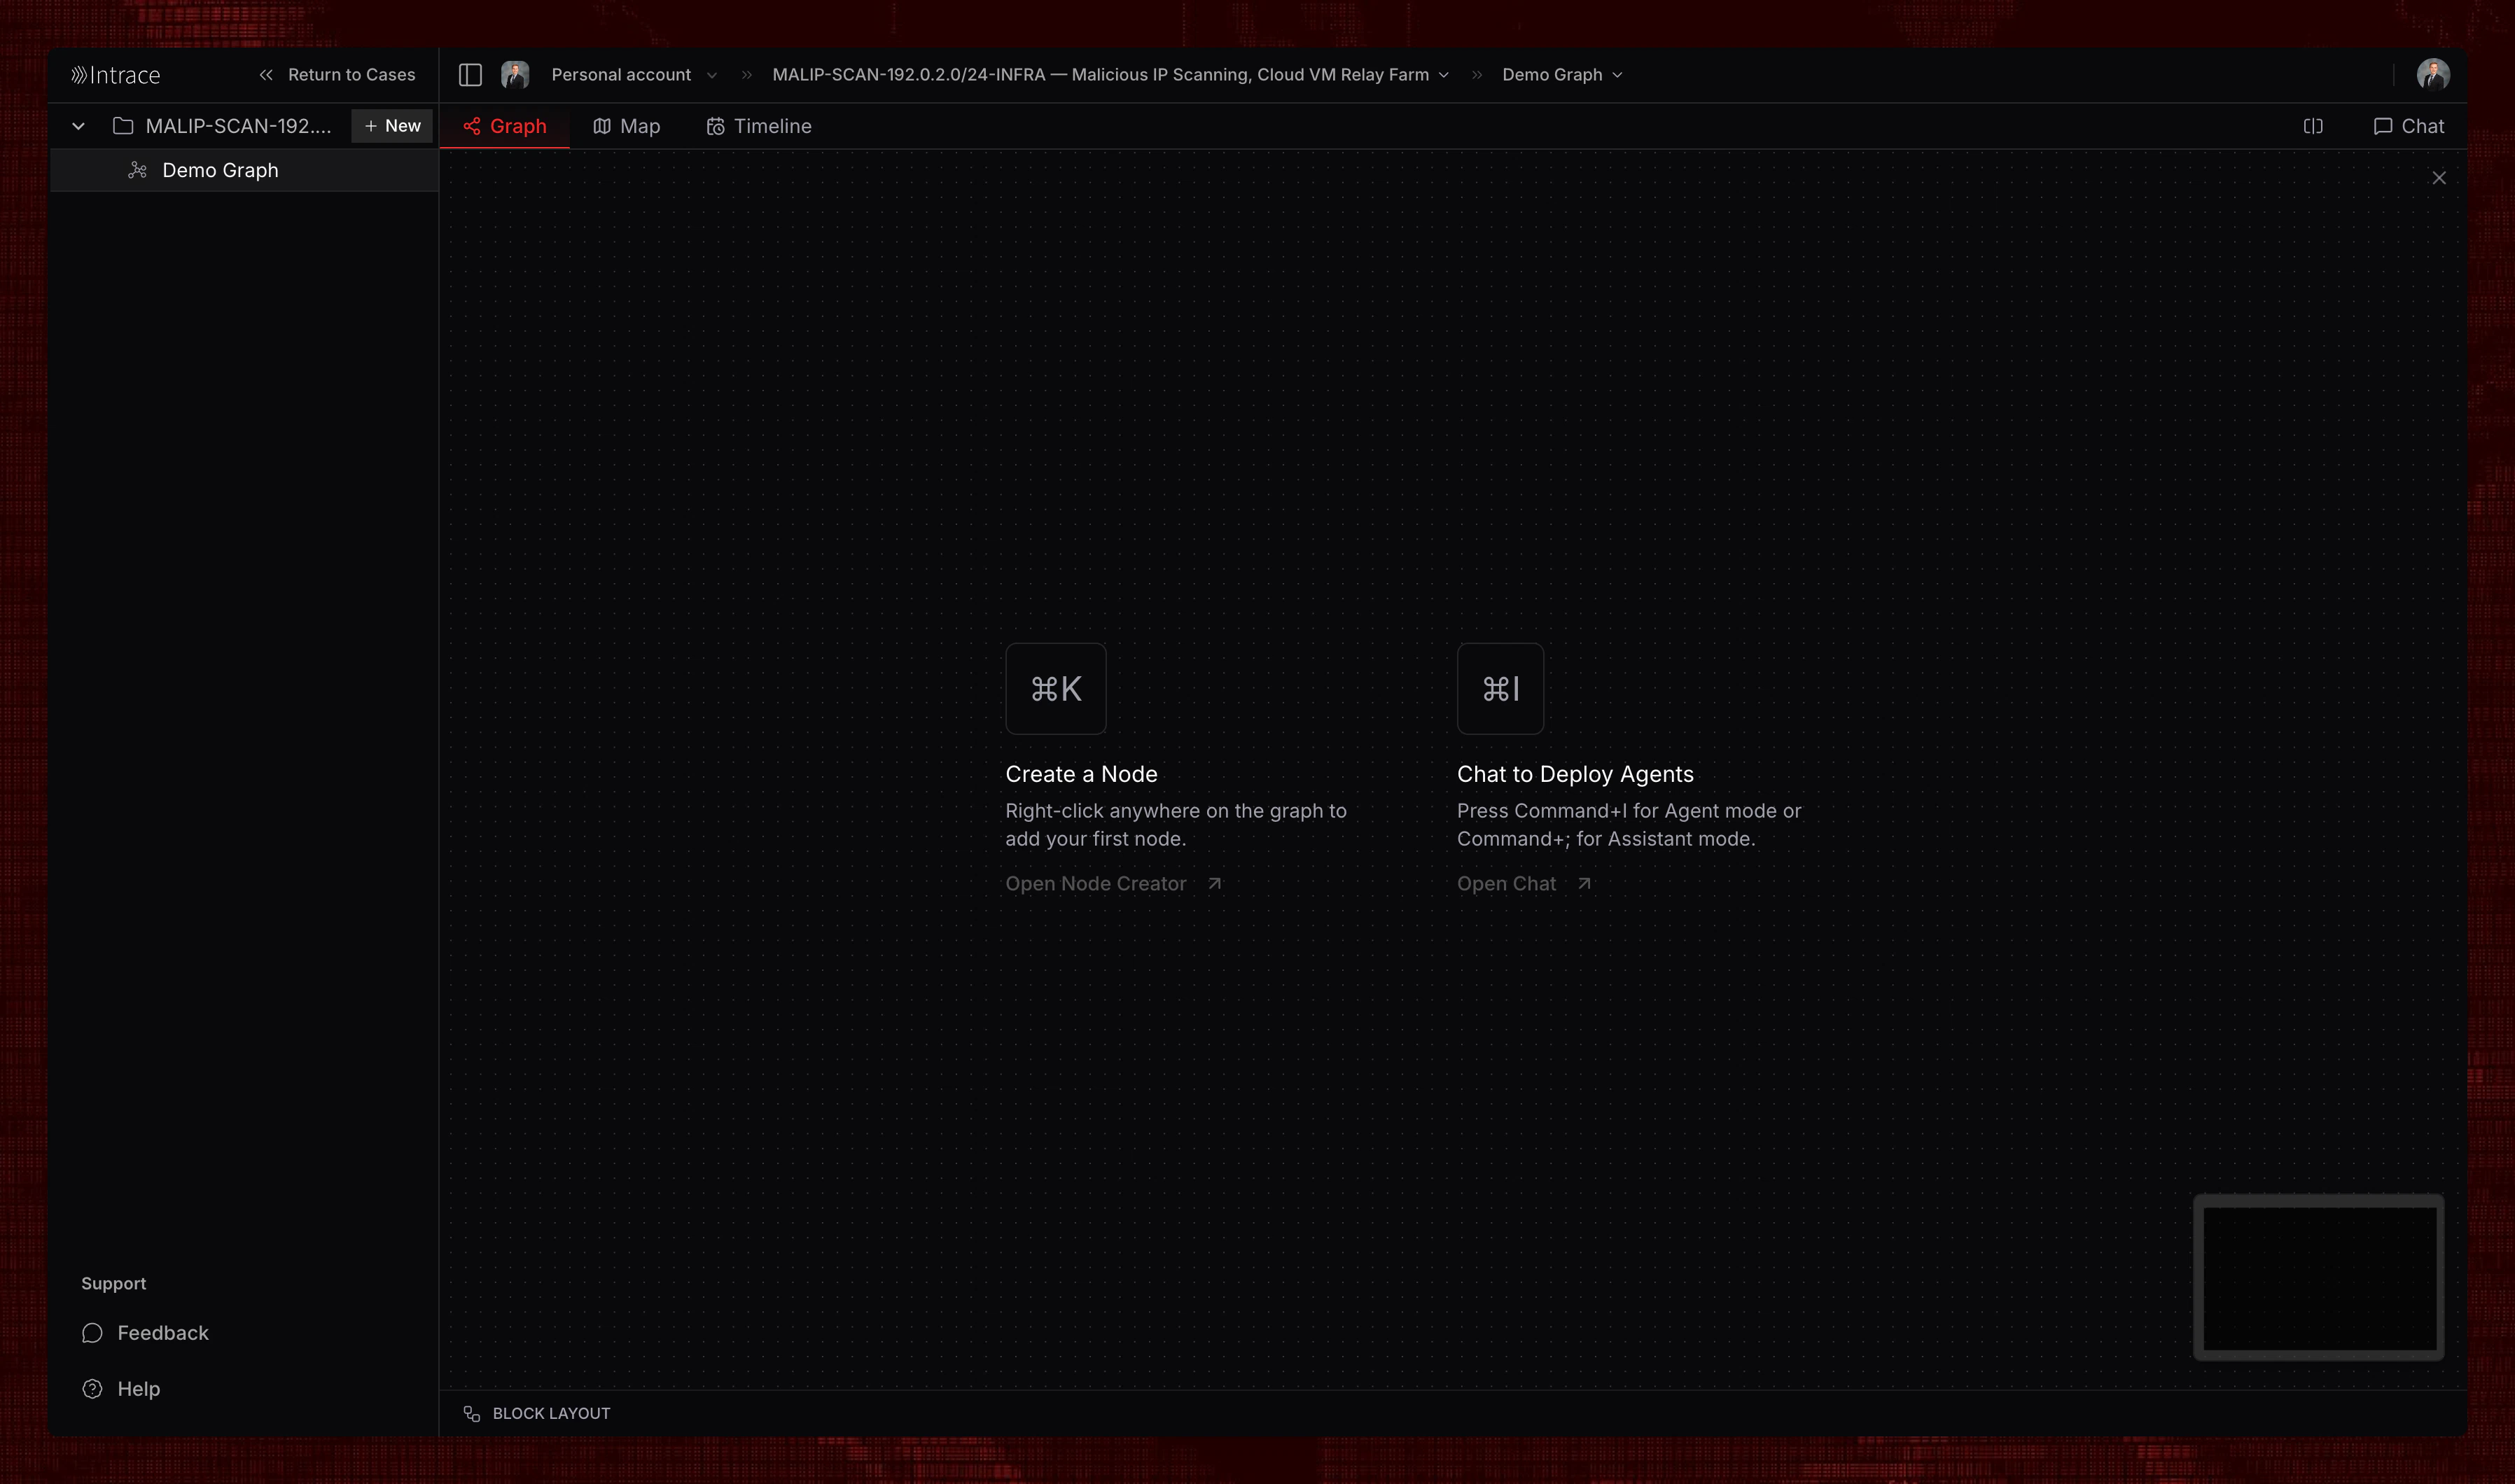
Right-click anywhere on the graph to open the node creation menu.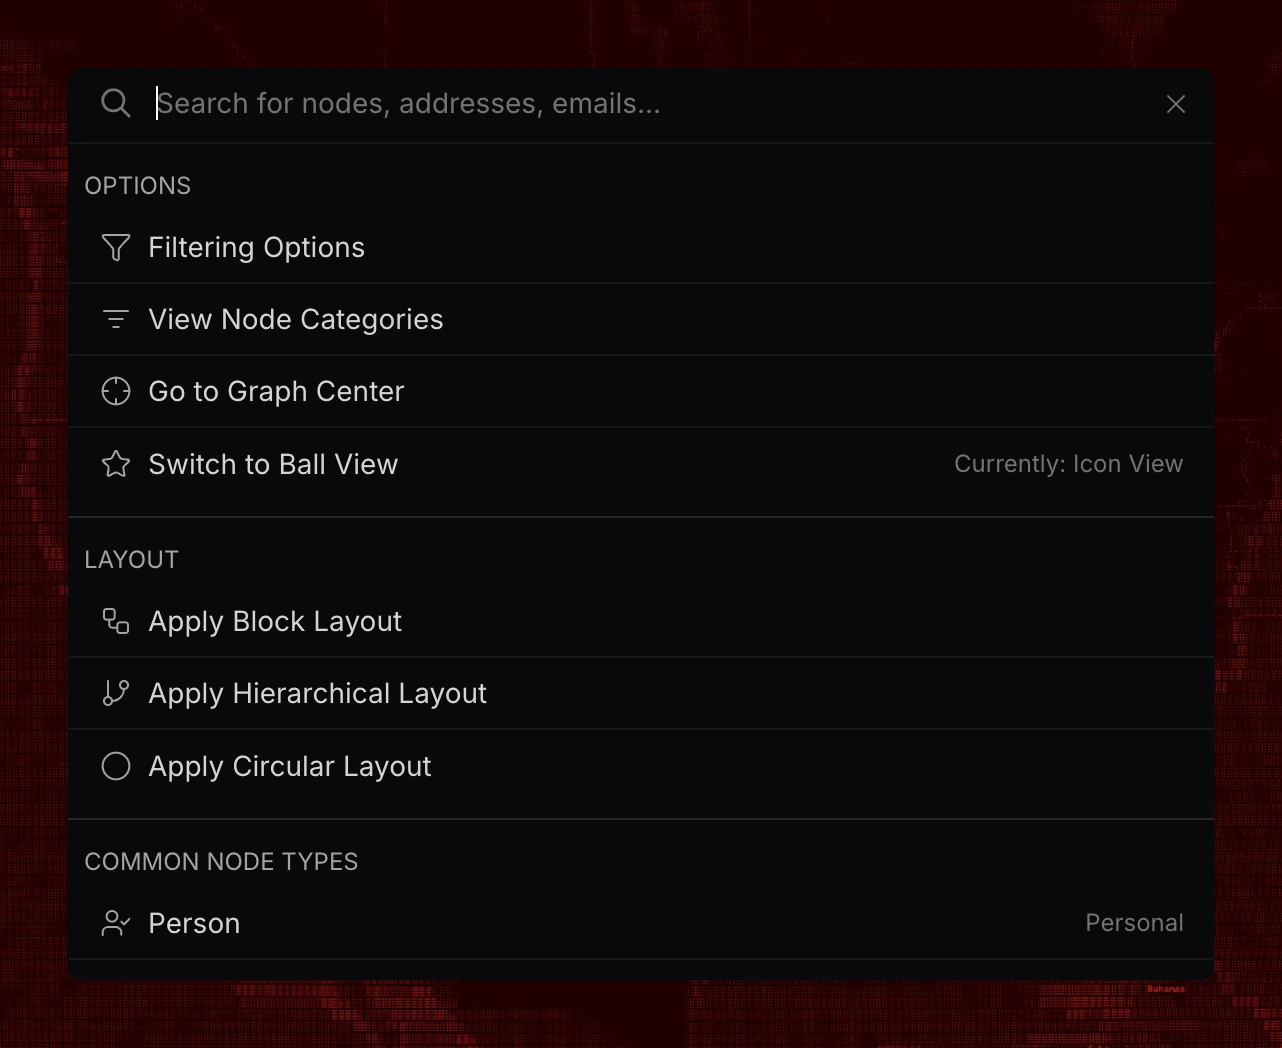
Filtering Node Types
Use filtering options to display only specific node types on the graph.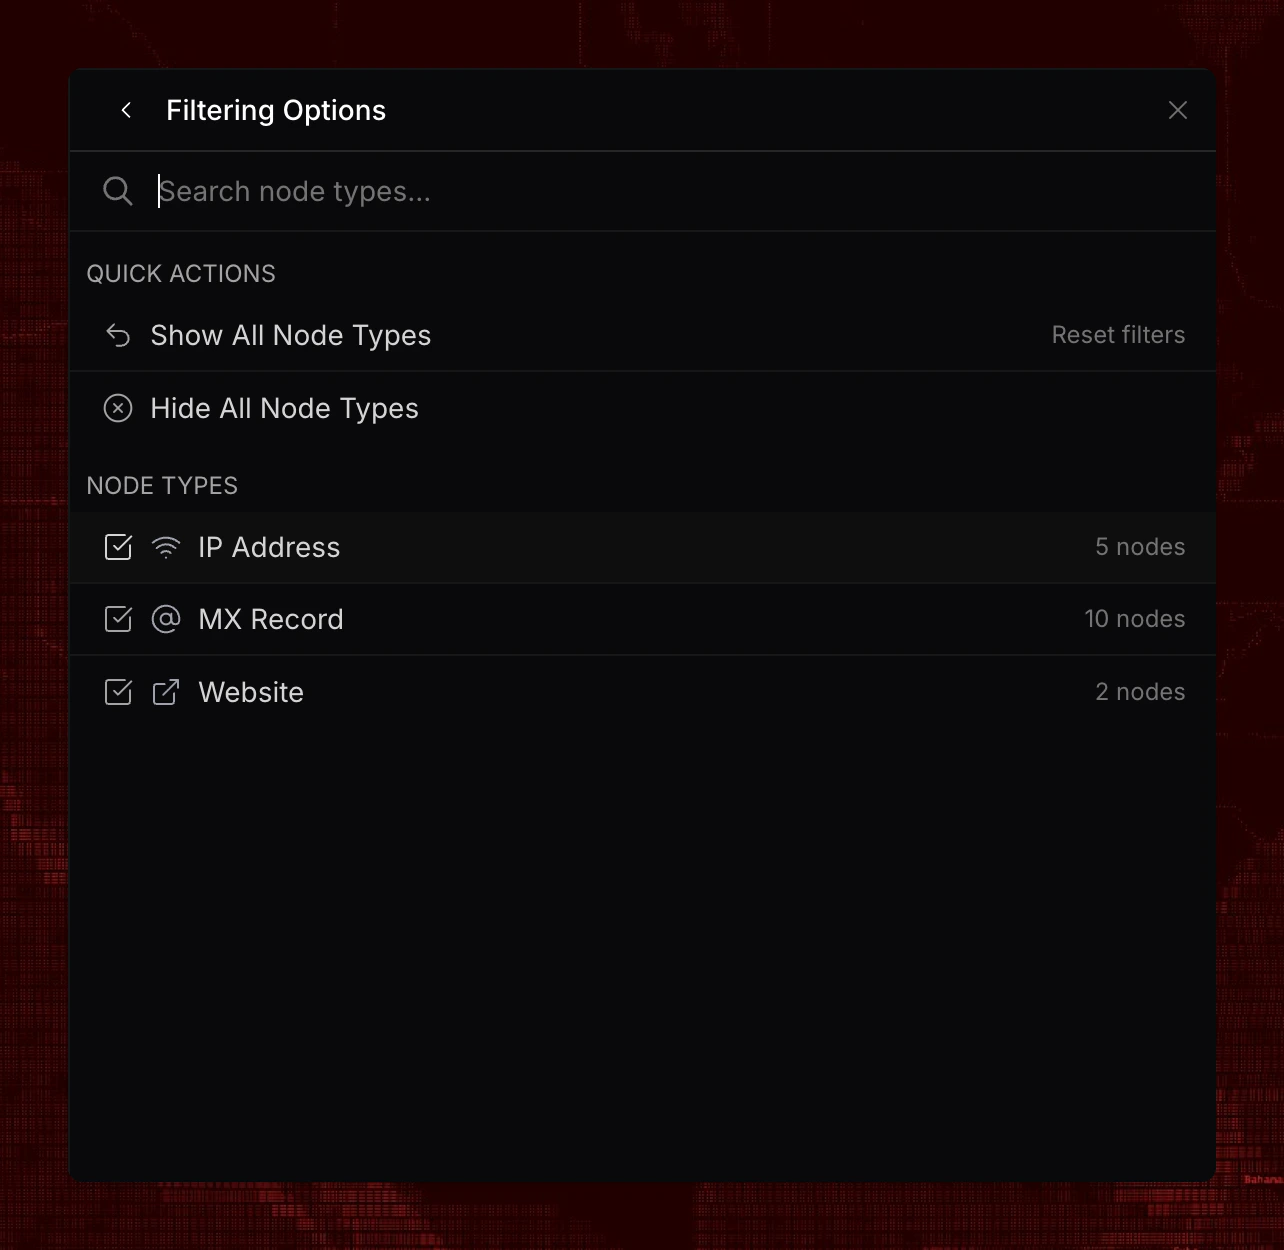
Node Categories
Nodes are organized into categories, each containing specific node types available for creation. See the complete directory of all nodes for comprehensive details.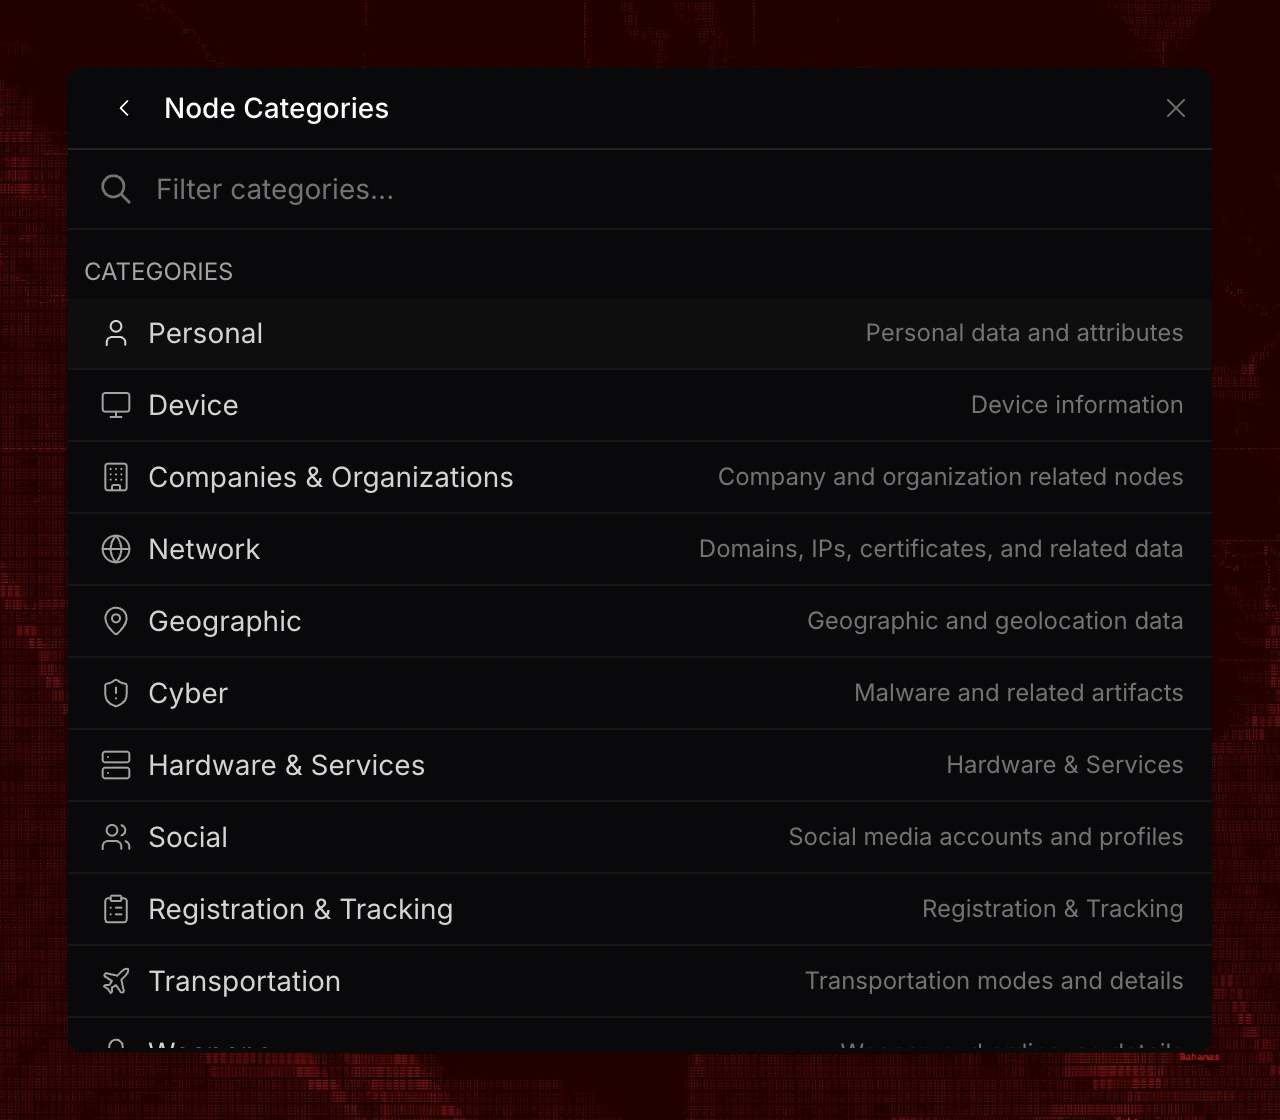
Creating a Node
Select a node type to open the configuration form. Enter values for available fields—all fields are optional.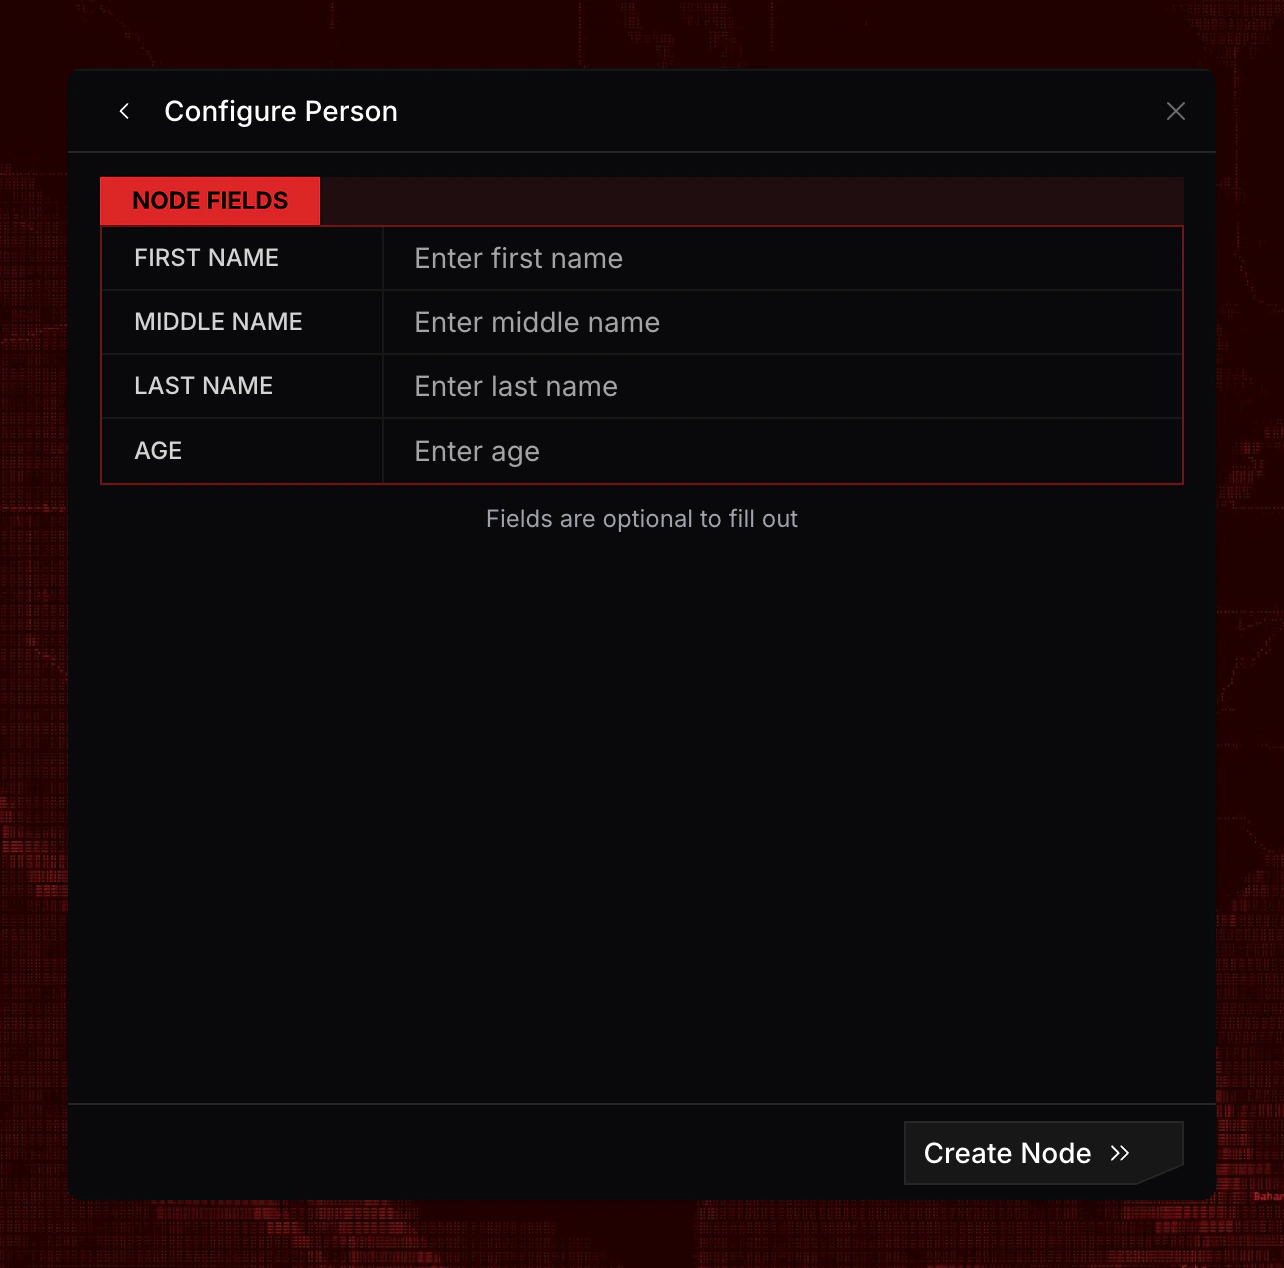
Quick Create
Type a recognizable value—such as a domain, email, phone number, or name—into the search bar to trigger quick create suggestions.
Nodes on the Graph
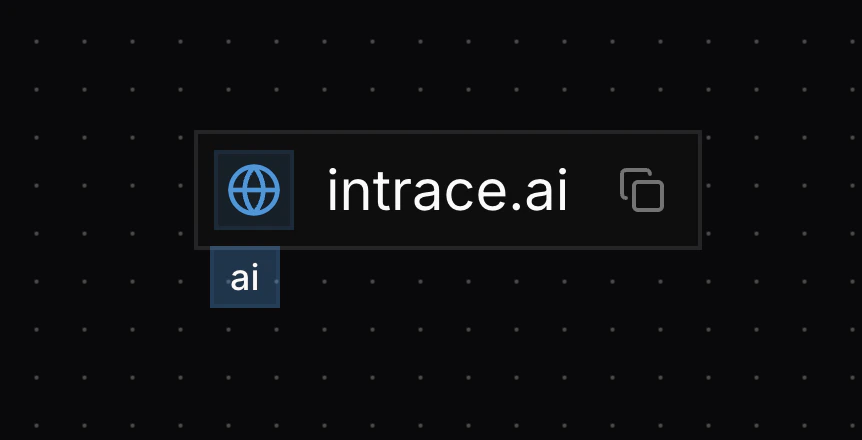
Nodes appear on the graph with an icon on the left, the display value in the center, and a copy button on the right. Some nodes include tags below the main value. While nodes can contain many fields, only one display value is shown on the graph.